Engineering by Investigation
Year 1 lab unit. Young's modulus of a steel ruler to within 8%, from a microphone, a breadboard preamp and a Raspberry Pi Pico logging at 5 kHz.
The summative lab
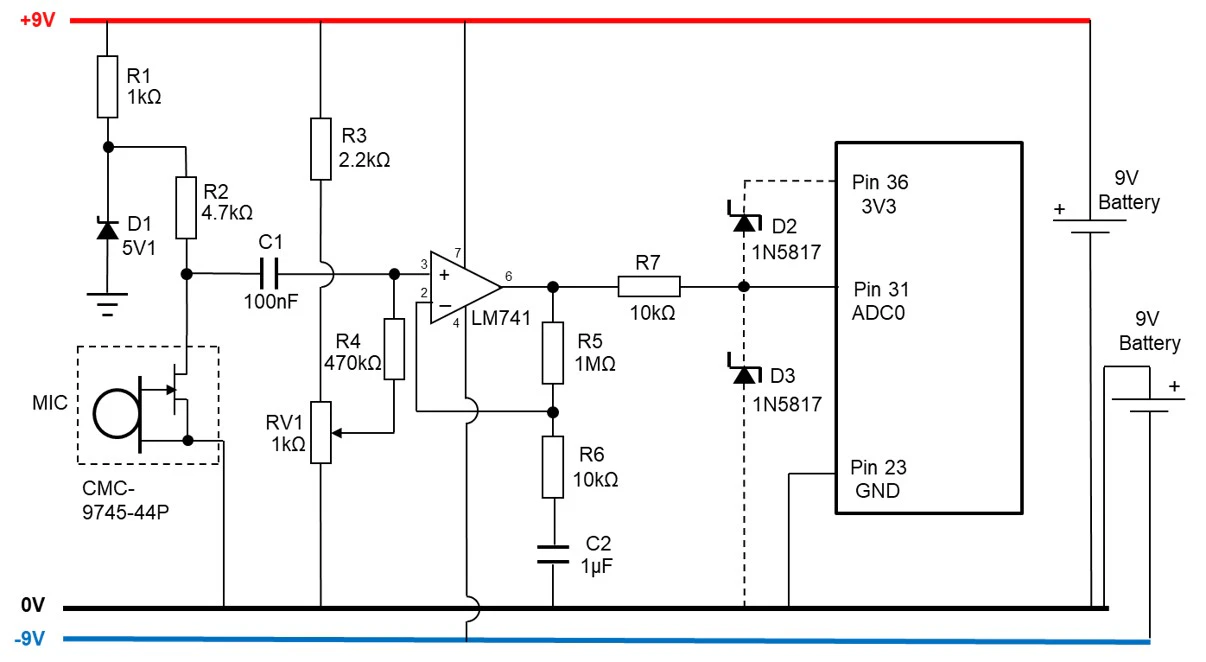
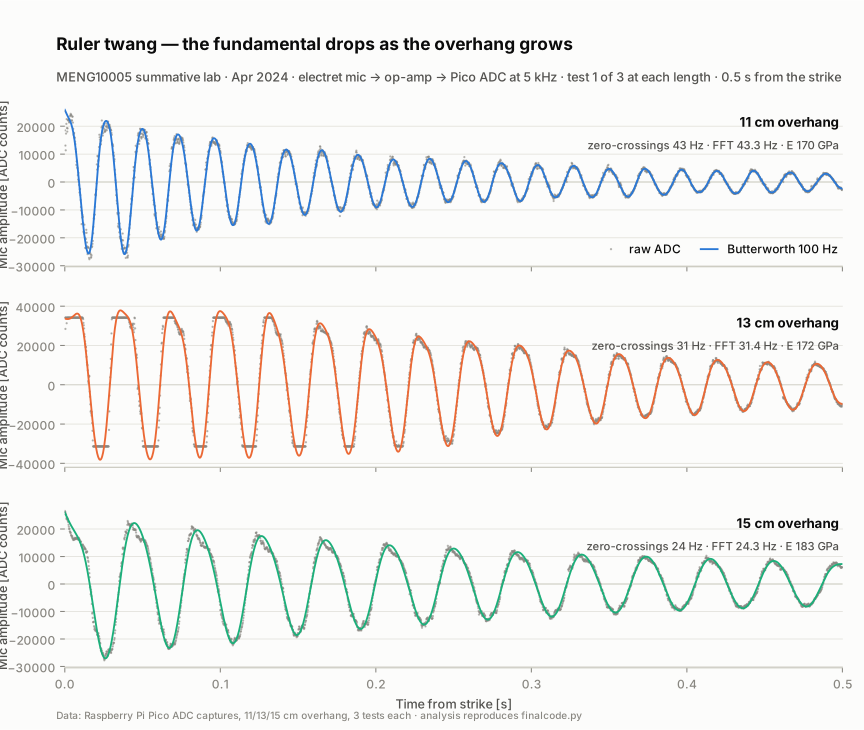
The brief: a ruler-shaped piece of unknown metal is proposed as an emergency replacement for an ambulance suspension part. Is it stiff enough to pass for stainless? I built the course's electret-mic preamp on a breadboard, an LM741 feeding a Raspberry Pi Pico ADC, clamped the ruler to the desk edge under a book and a Bluetooth speaker, and put the mic on a parts box under the free end. Flick, record 3 s at 5 kHz, repeat: three tests at each of 11, 13 and 15 cm overhang, nine captures.
Count the crossings
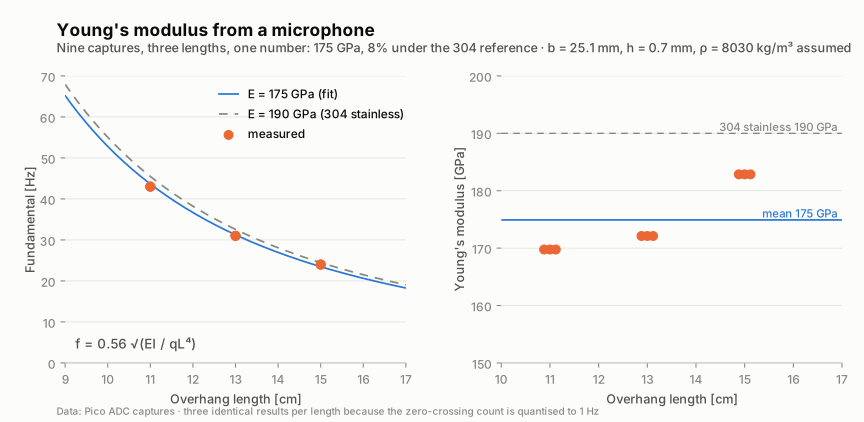
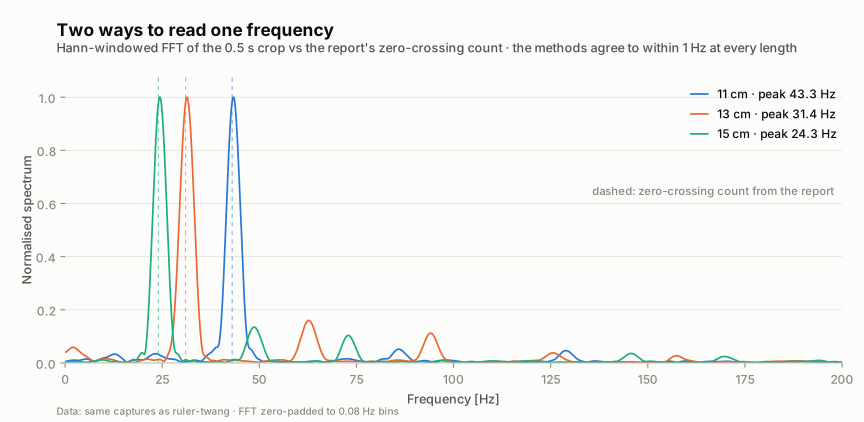
Each capture: remove the DC offset, crop half a second from the strike, fourth-order Butterworth low-pass, count zero crossings. That gives 43, 31 and 24 Hz for the three overhangs, and every test at a length gives the same number because a count over 0.5 s is quantised to 1 Hz. An FFT cross-check, added afterwards, lands within 0.4 Hz. The 13 cm captures clip at the ADC rails for the first 0.15 s or so; a peak-based method would have been fooled, a crossing count is not.
175 GPa, give or take 10
Invert the cantilever formula f = 0.56 sqrt(EI/qL^4) for E, with I from a 25.1 by 0.7 mm section. Per length: 170, 172 and 183 GPa; mean 175 GPa, 8% under the 190 GPa quoted for 304 stainless, so the report calls the part suitable. E climbs with overhang, a systematic trend the report did not discuss. A slightly over-measured 0.7 mm thickness or clamp compliance at the short overhangs would do it. Read the number as 175 plus or minus 10, not better.
A ruler on two pens
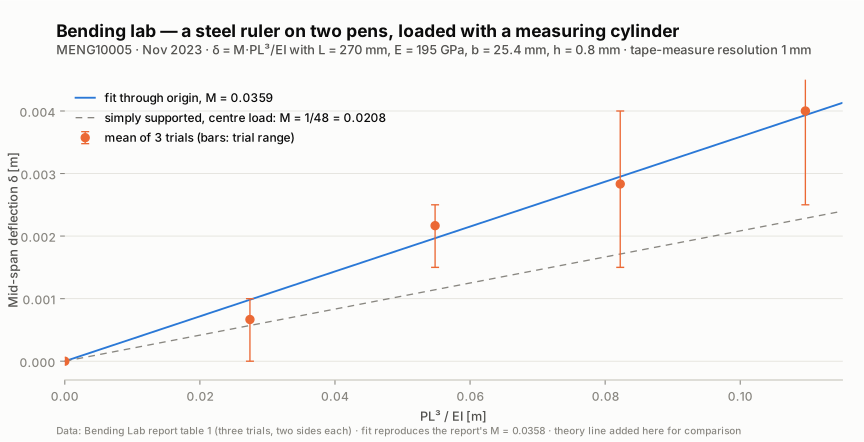
First term. A steel ruler across two chairs on a pen and a pencil, 270 mm between the inner edges, a measuring cylinder at mid-span filled in 30 mL steps, deflection read off a tape measure held to the ruler edge. Plotting deflection against PL^3/EI gives M = 0.0358 in delta = M PL^3/EI. Textbook for a centre-loaded simply-supported beam is 1/48 = 0.0208, so mine is 1.7 times high: 0.7 to 4 mm deflections read with a 1 mm tape, round supports, and a 0.8 mm thickness cubed in I.
Then the design problem: a 50 kN, 25 m hospital roof beam limited to 140 mm deflection comes out 391 mm deep, between stock 364 and 406 mm sections.
A kettle
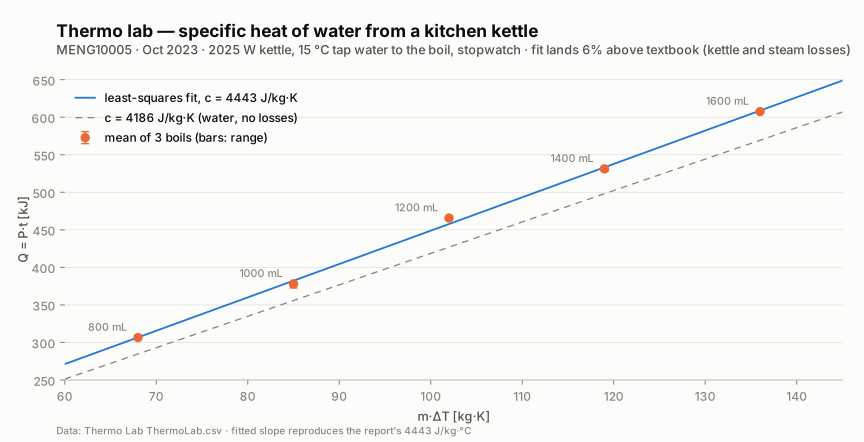
Specific heat of water from a 2025 W kitchen kettle: 800 to 1600 mL in 200 mL steps, three boils at each volume, a stopwatch. Plot Q = P t against m dT, tap water at 15 C to 100 C, and the slope is c: 4443 J/kg K, 6% above the 4186 in the tables. No PDF for this one; the data and the fit are here.
Tensile
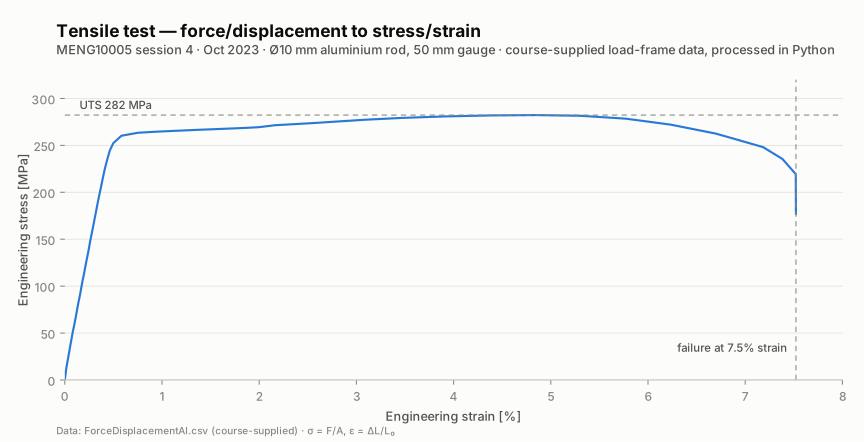
Session 4, the first Python lab: a course-supplied load-frame CSV for a 10 mm diameter aluminium rod, force and displacement to stress and strain. UTS 282 MPa at a peak force of 22.17 kN, 7.5% strain to failure. The same sessions covered scipy curve fitting, regression with error bars, quadrature and minimisation, and the Pico GPIO exercises: traffic light, button, PWM from a pot, a four-LED light-level bargraph. The original plot had strain labelled in mm; this one is in percent.
Reports
Both reports as submitted, six pages each: the summative lab from April 2024 and the bending lab from December 2023. The thermo report only exists as a Word file, so it is not here; its data and fit are above.