Dynamics and Control of Linear Systems
Flutter speed of a two-degree-of-freedom aerofoil read off its root locus, then spacecraft attitude controllers tuned by a hand-written genetic algorithm and particle swarm in MATLAB and Simulink.
The brief
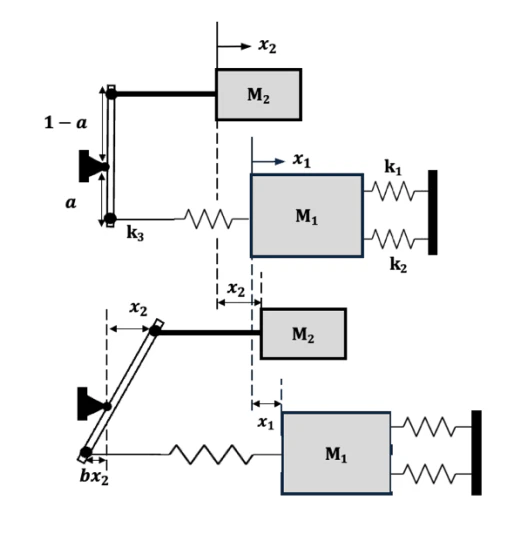
Second-year unit in two halves. Vibrations and Aeroelasticity: a single-degree-of-freedom aerofoil rig, a tuned vibration absorber, a two-mass lever system by Lagrange and by Newton, and a two-degree-of-freedom flutter analysis. Signals, Systems and Control: diagnose a faulty amplifier from time-domain metrics, recover a harmonic from a noisy aliased record with an FFT, size a mirror actuator from a Bode plot, and tune two attitude controllers for a spacecraft with flexible appendages. All MATLAB and Simulink, submitted April 2025.
Vibrations and aeroelasticity
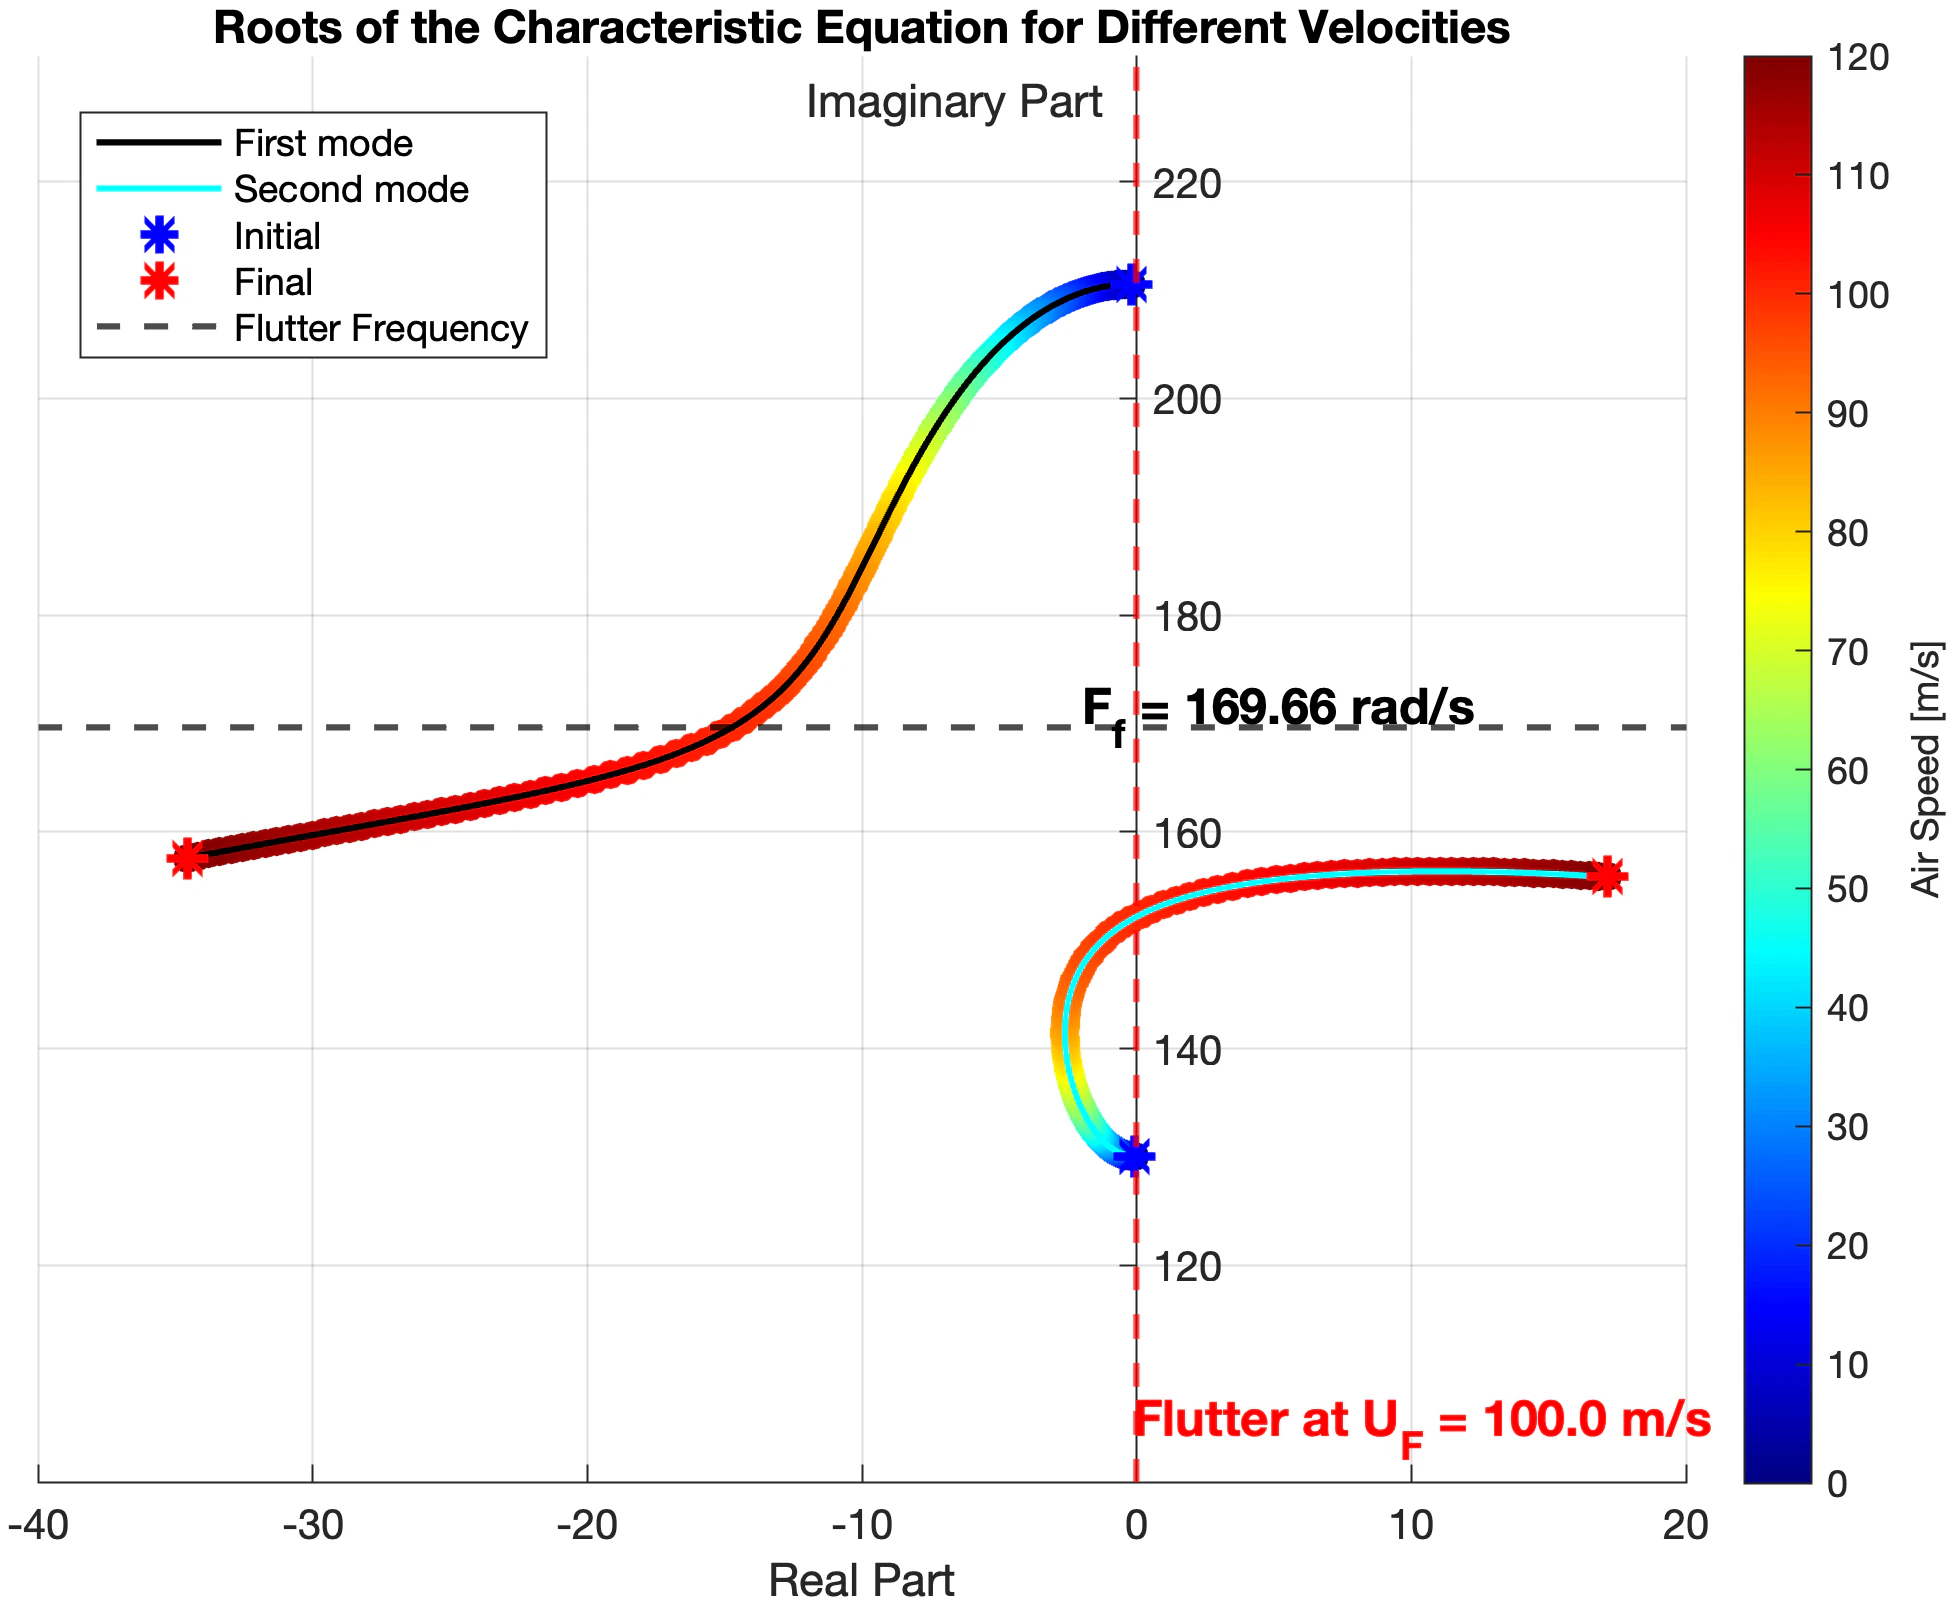
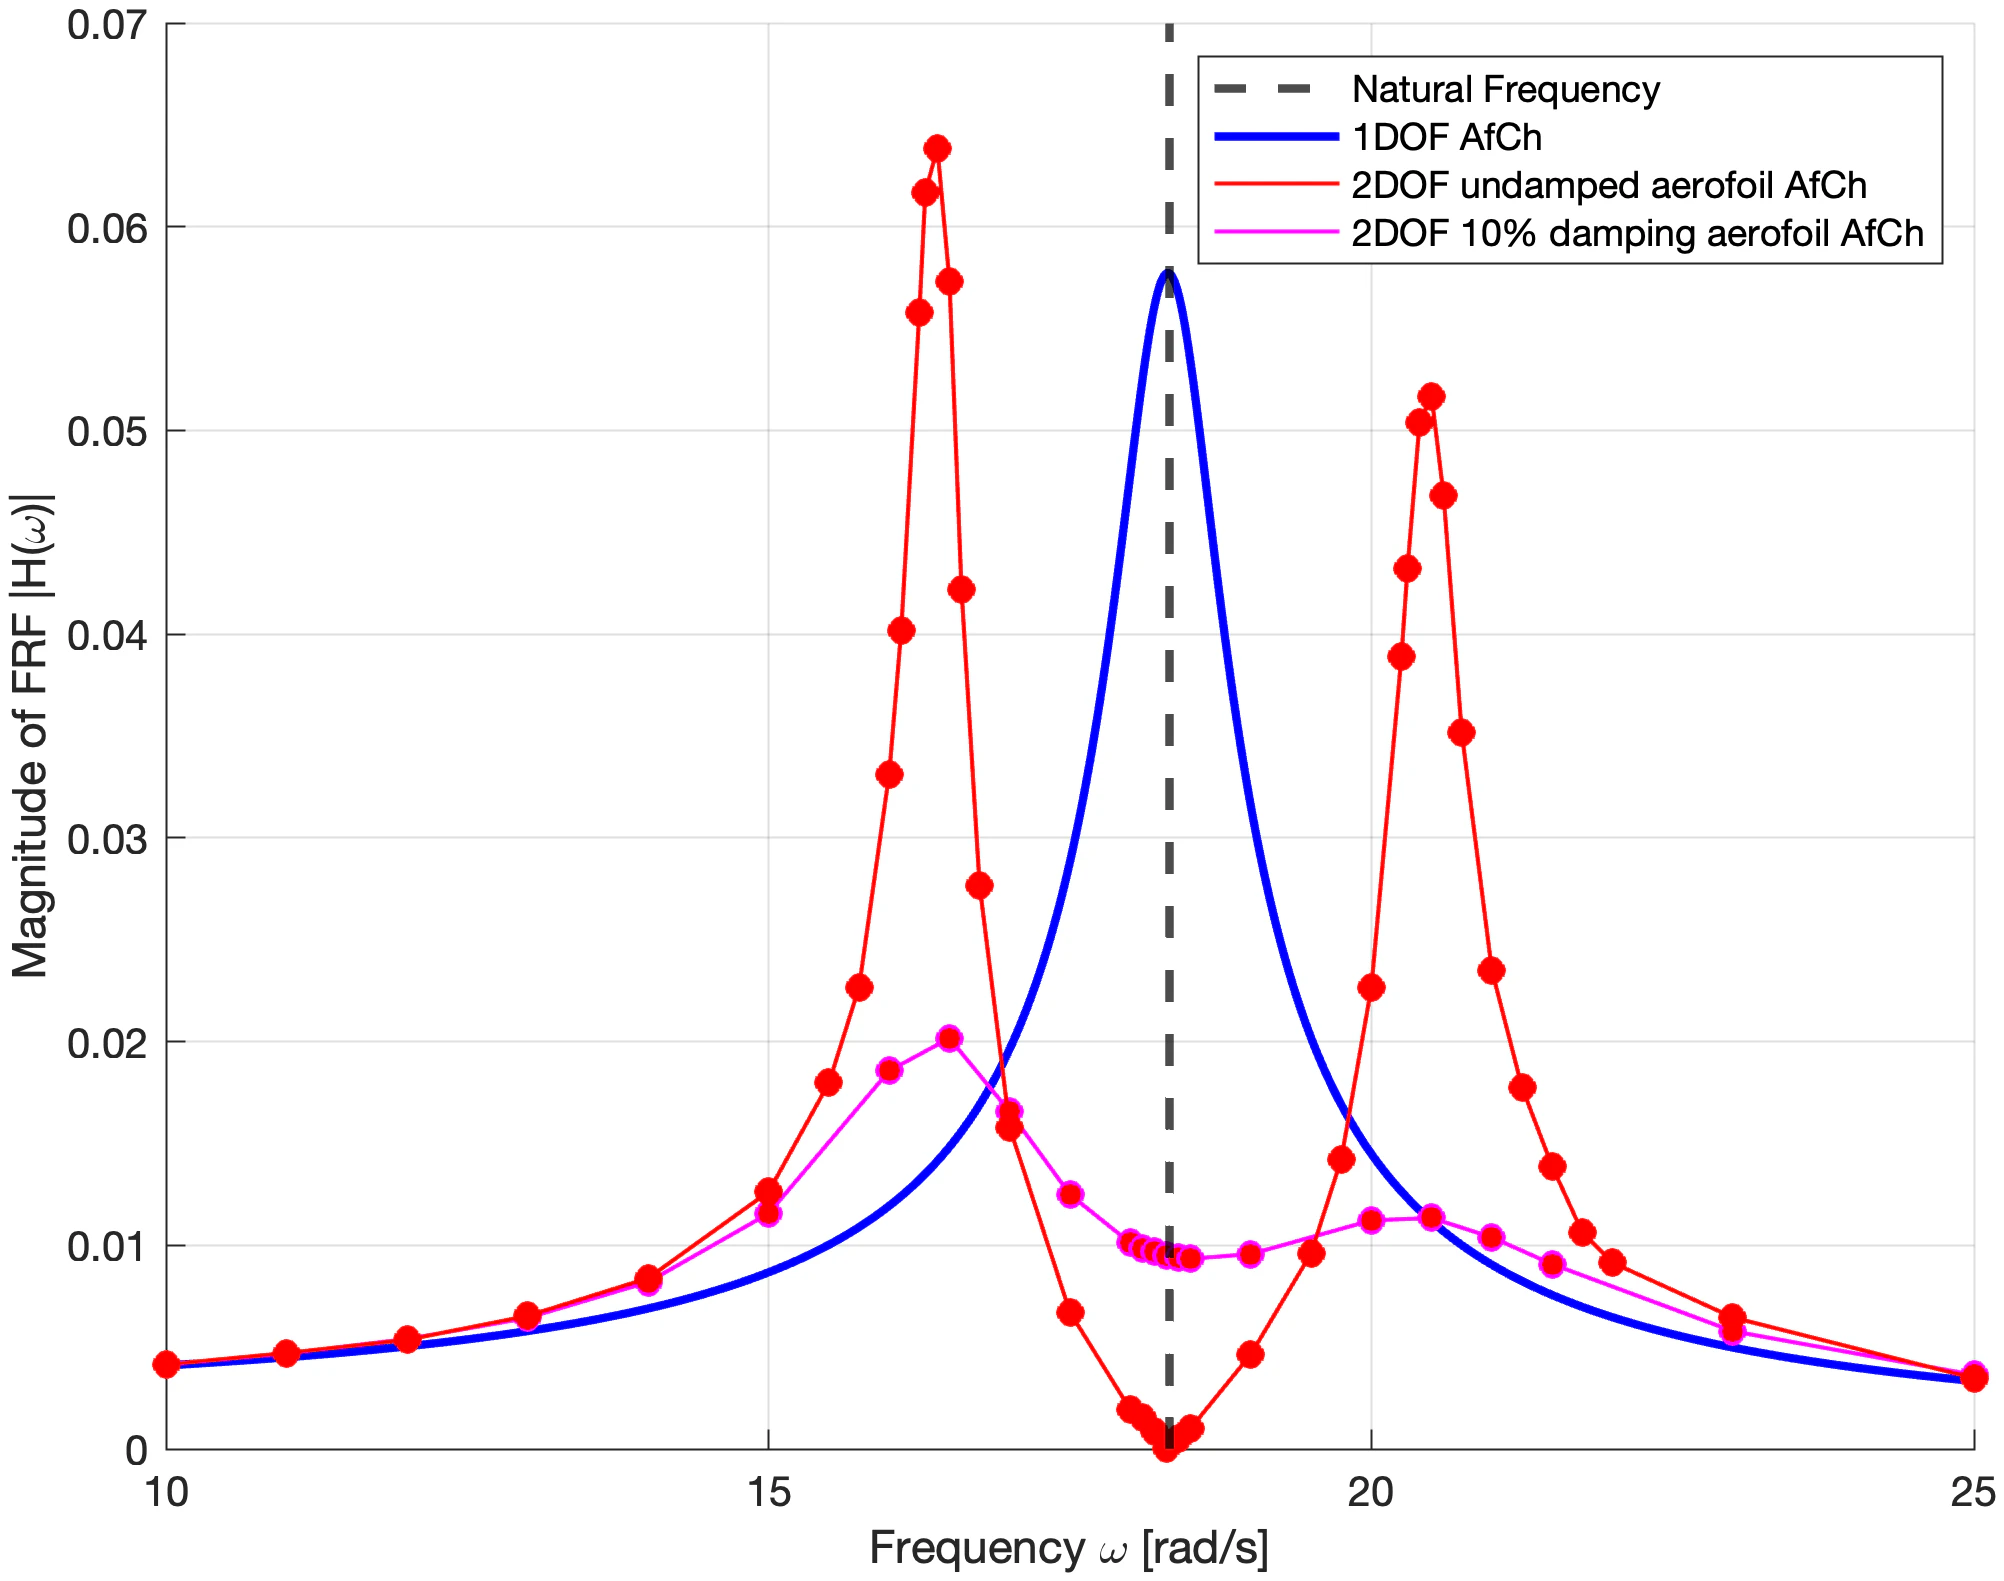
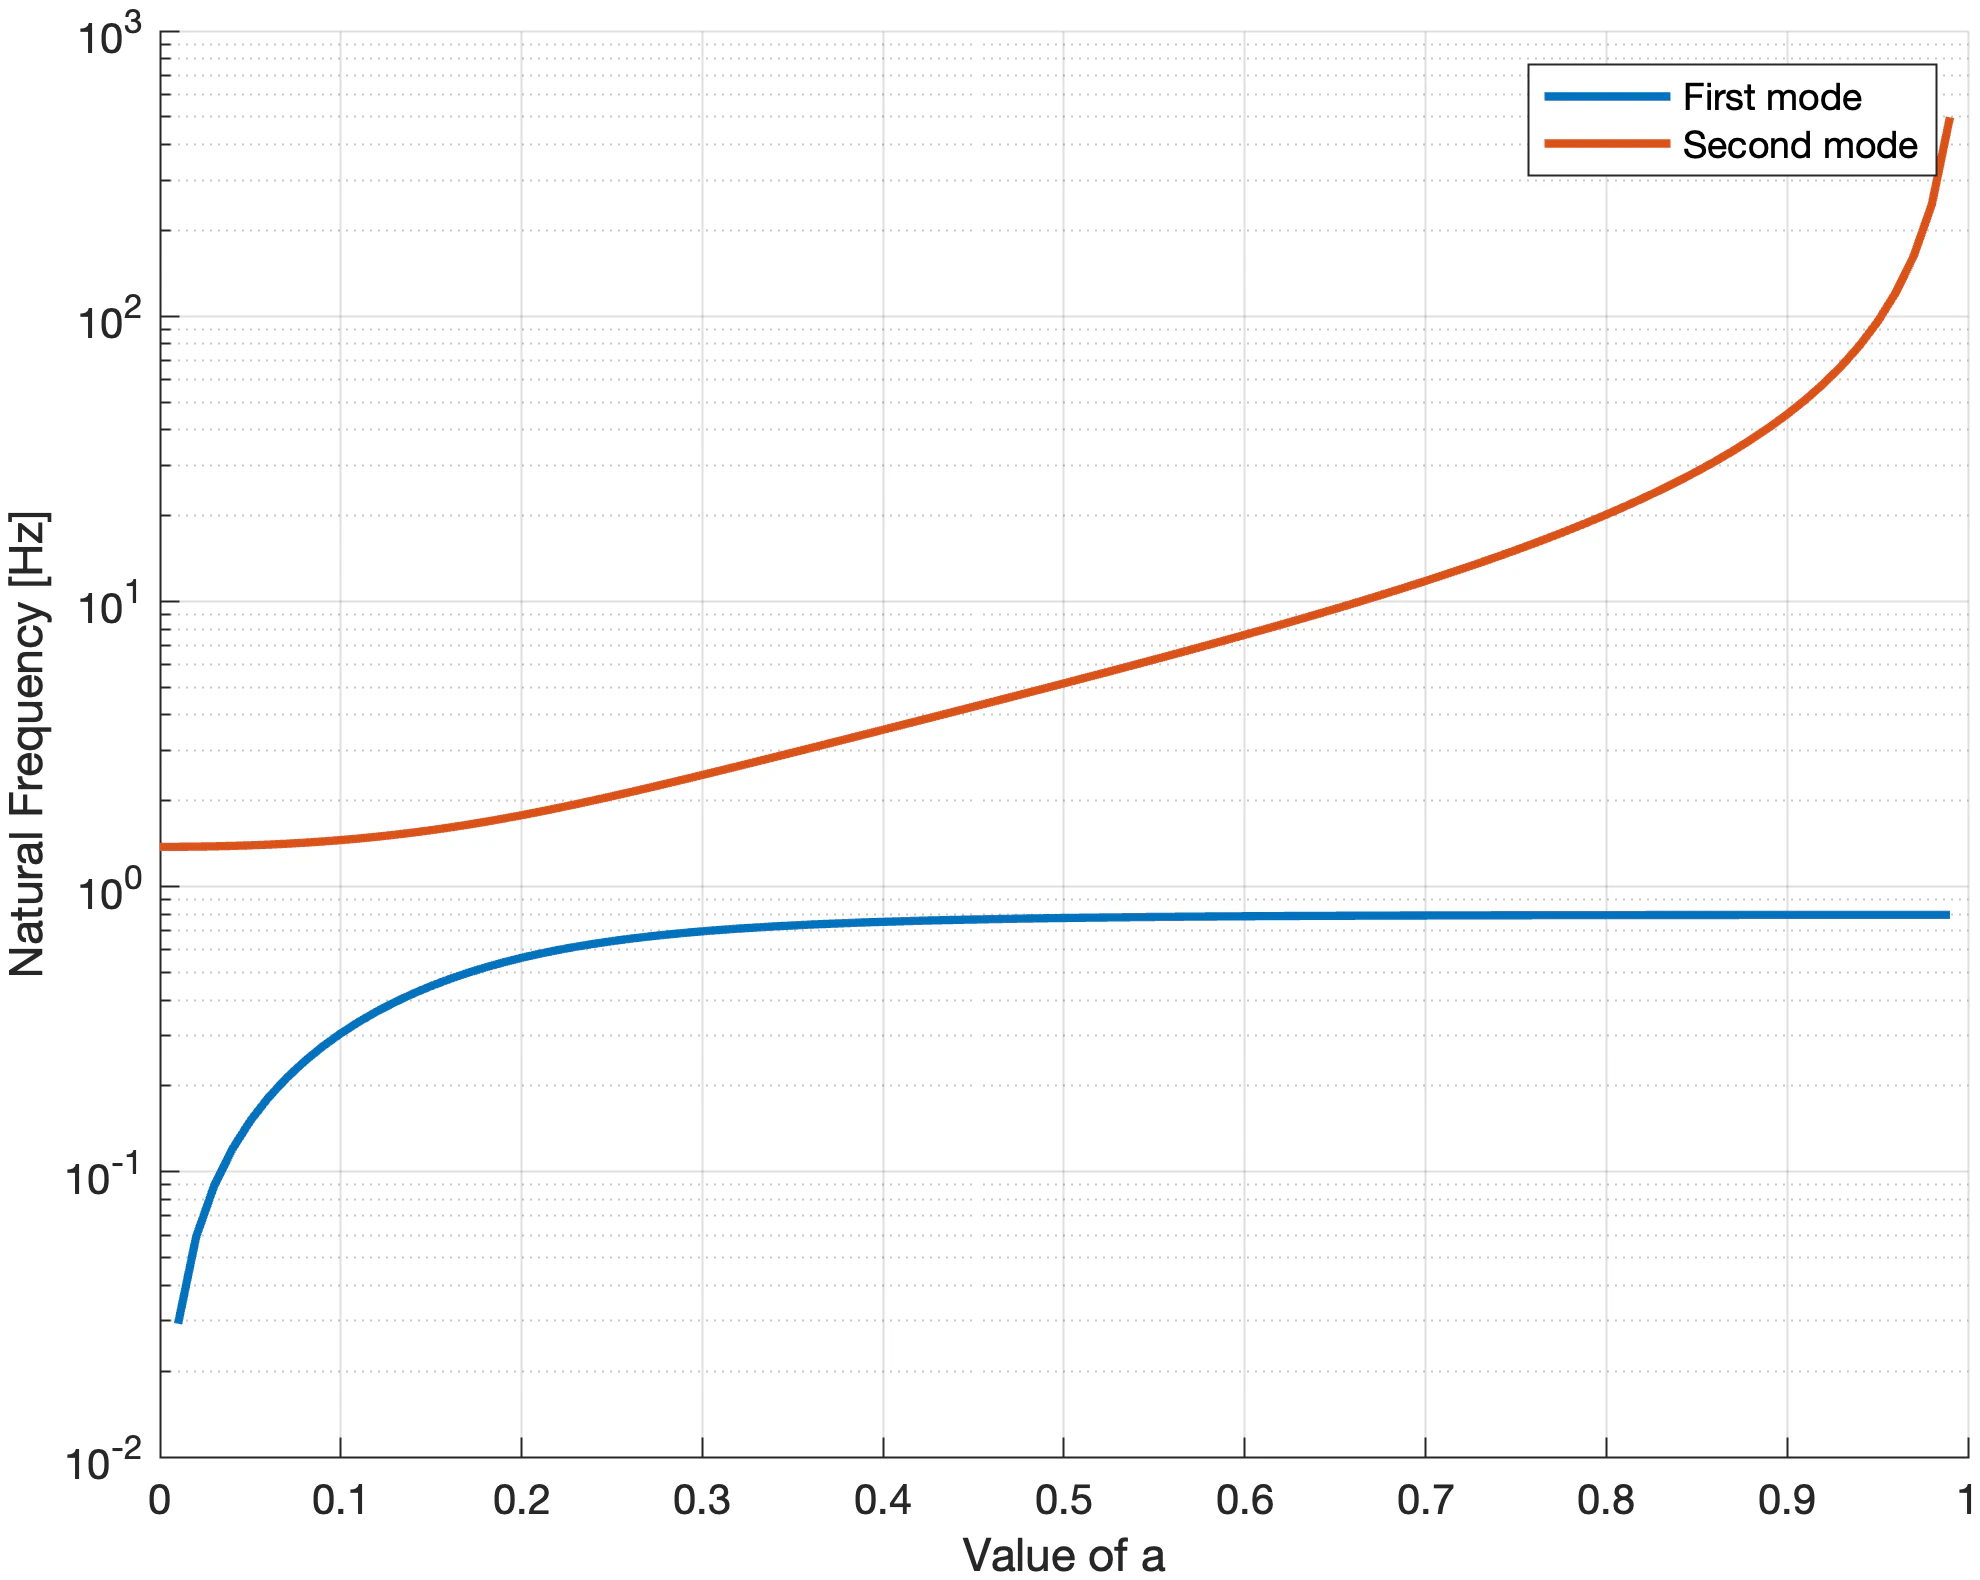
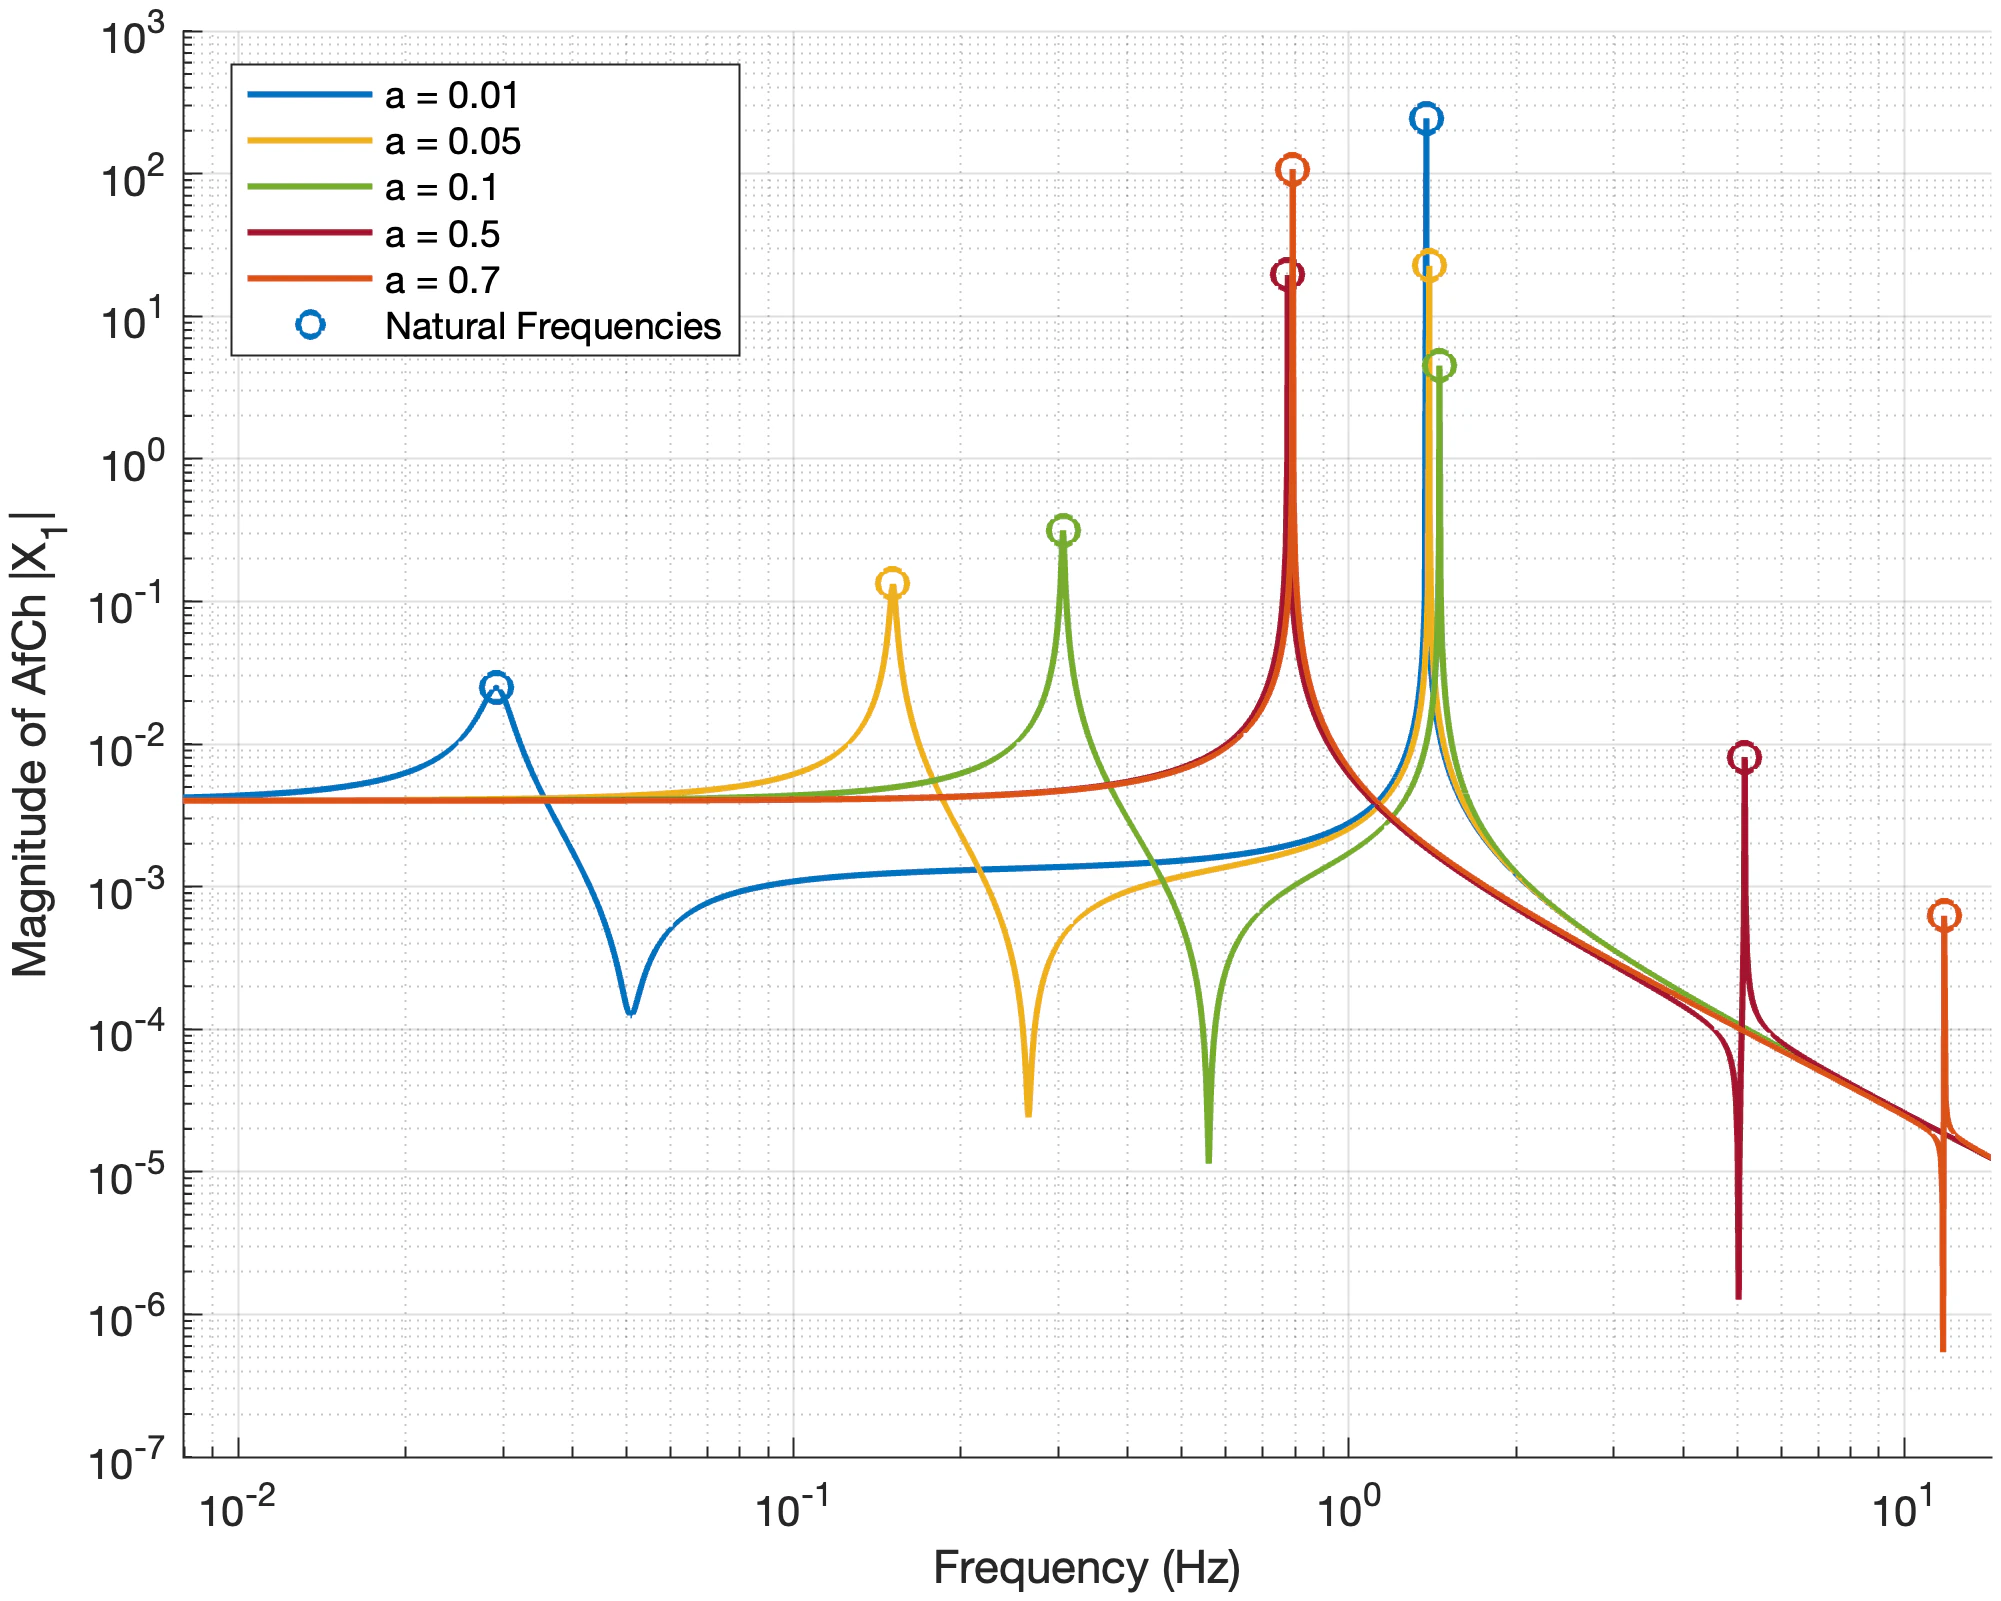
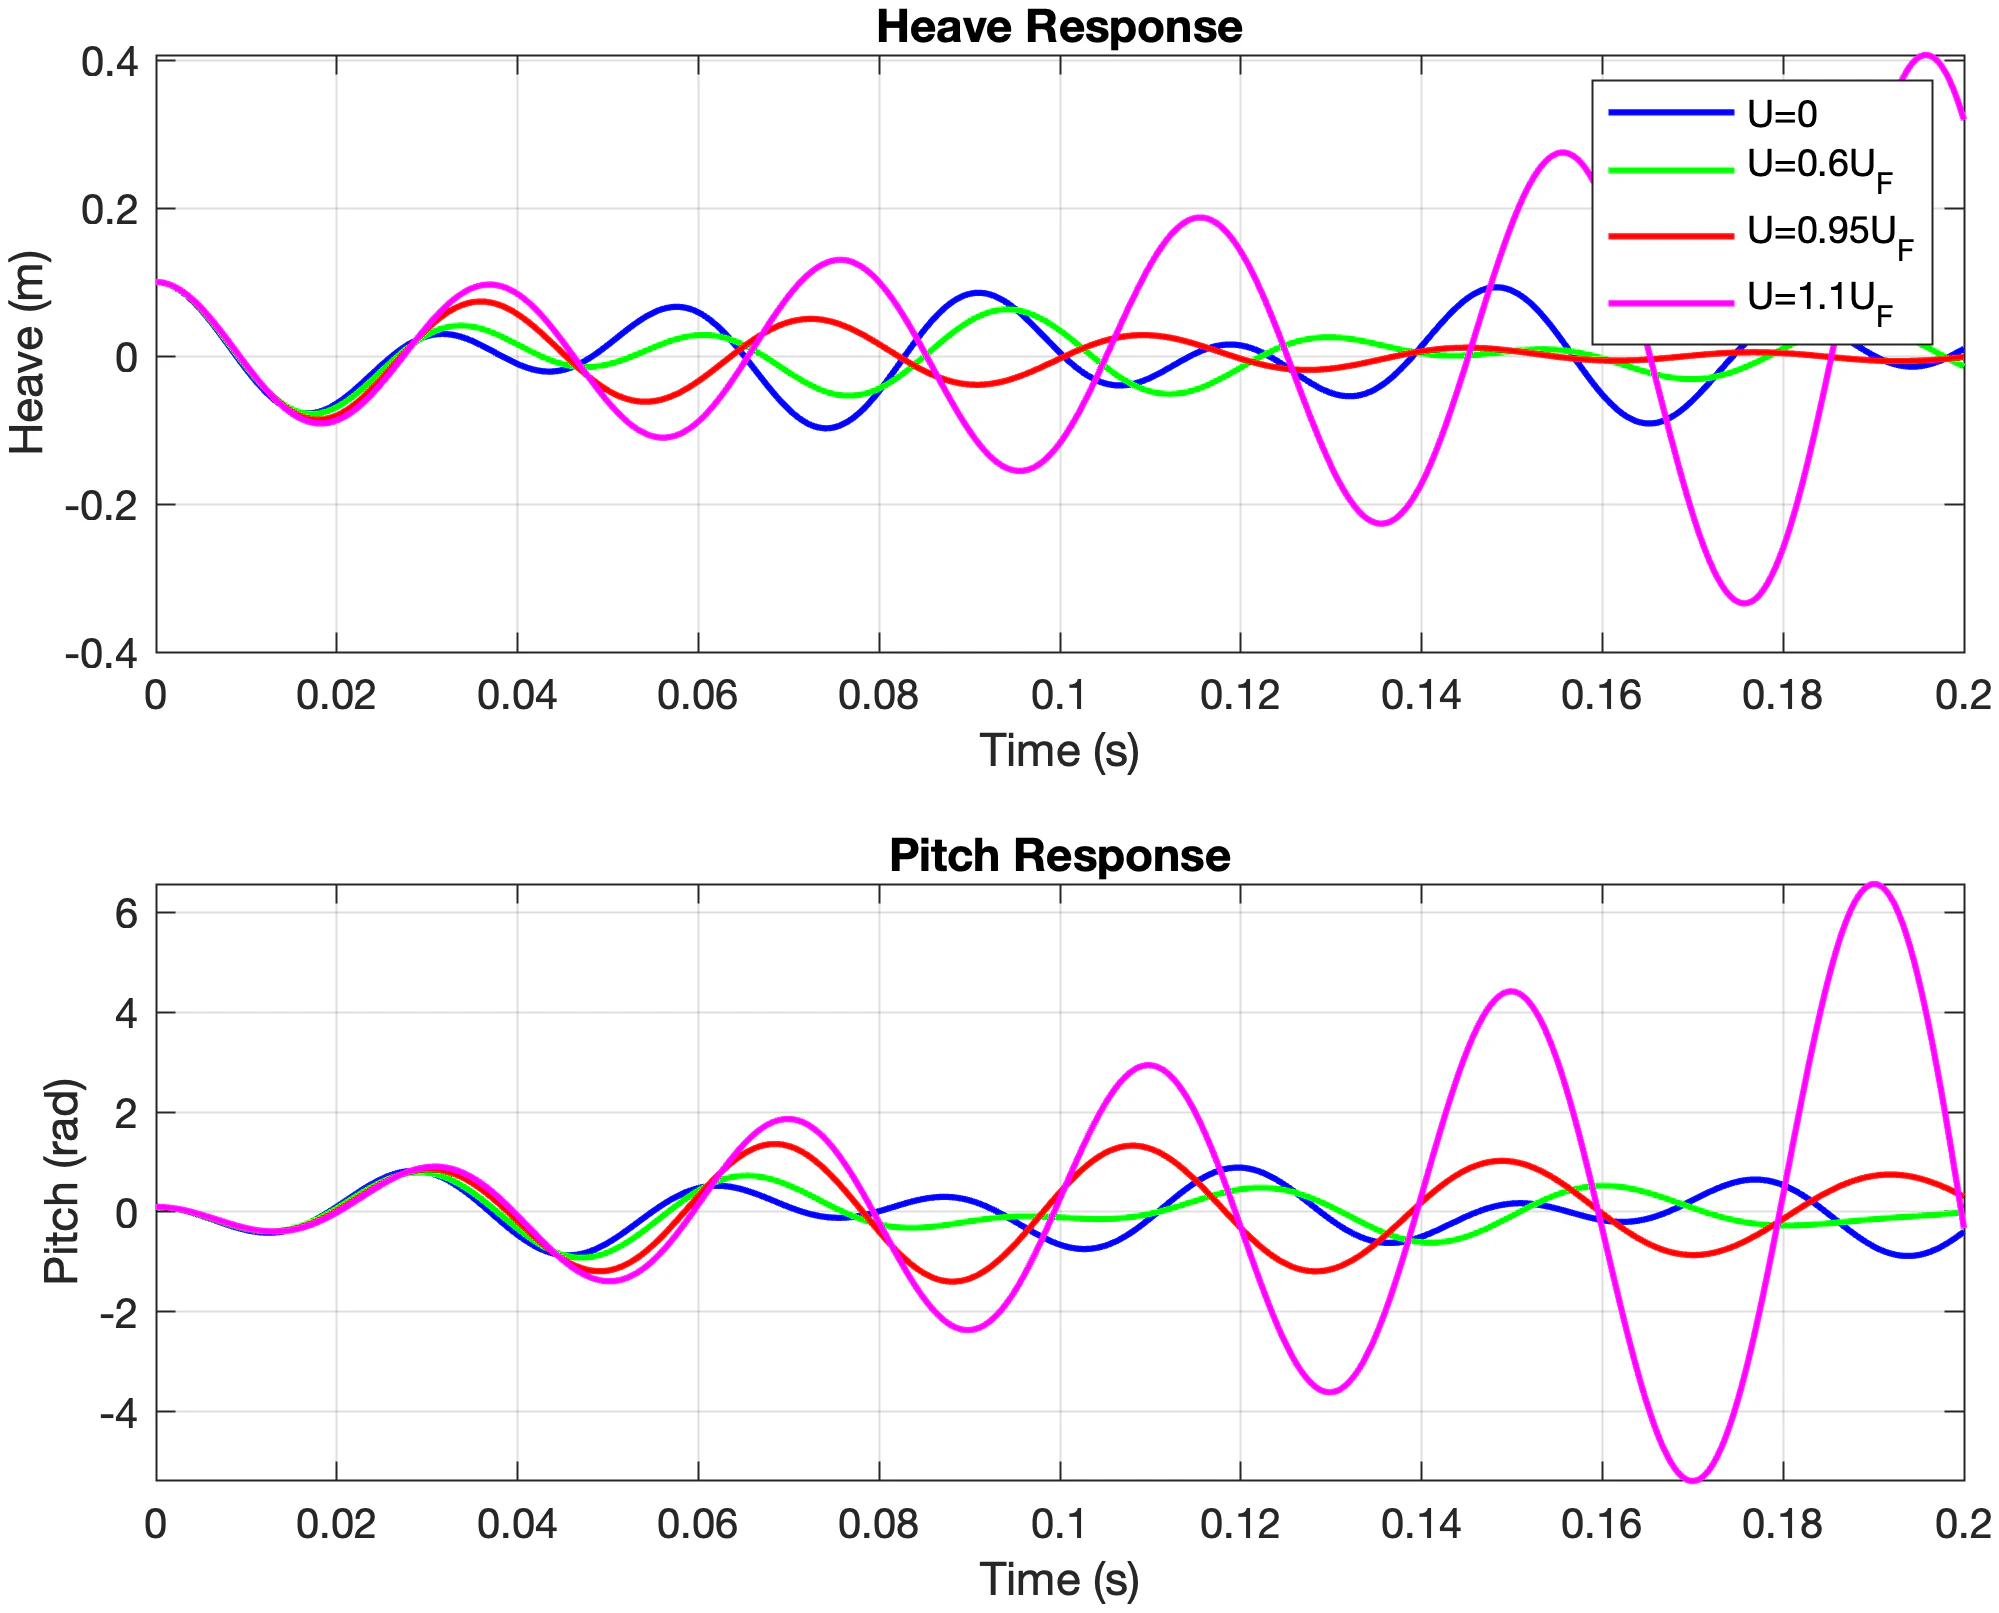
The aerofoil's inertia, stiffness and damping came from a logarithmic decrement between the first and tenth peaks of a free decay. A tuned vibration absorber at 5 percent of the equivalent mass split the resonance into two peaks with an anti-resonance at the old natural frequency, and 10 percent damping in the absorber flattened both. For the lever-coupled two-mass system the Lagrange and Newton derivations matched, and sweeping the pivot ratio showed the first mode saturating while the second climbed without bound. The flutter analysis tracked the four roots of the characteristic equation from 0 to 120 m/s and called flutter where a real part first went positive.
Signals
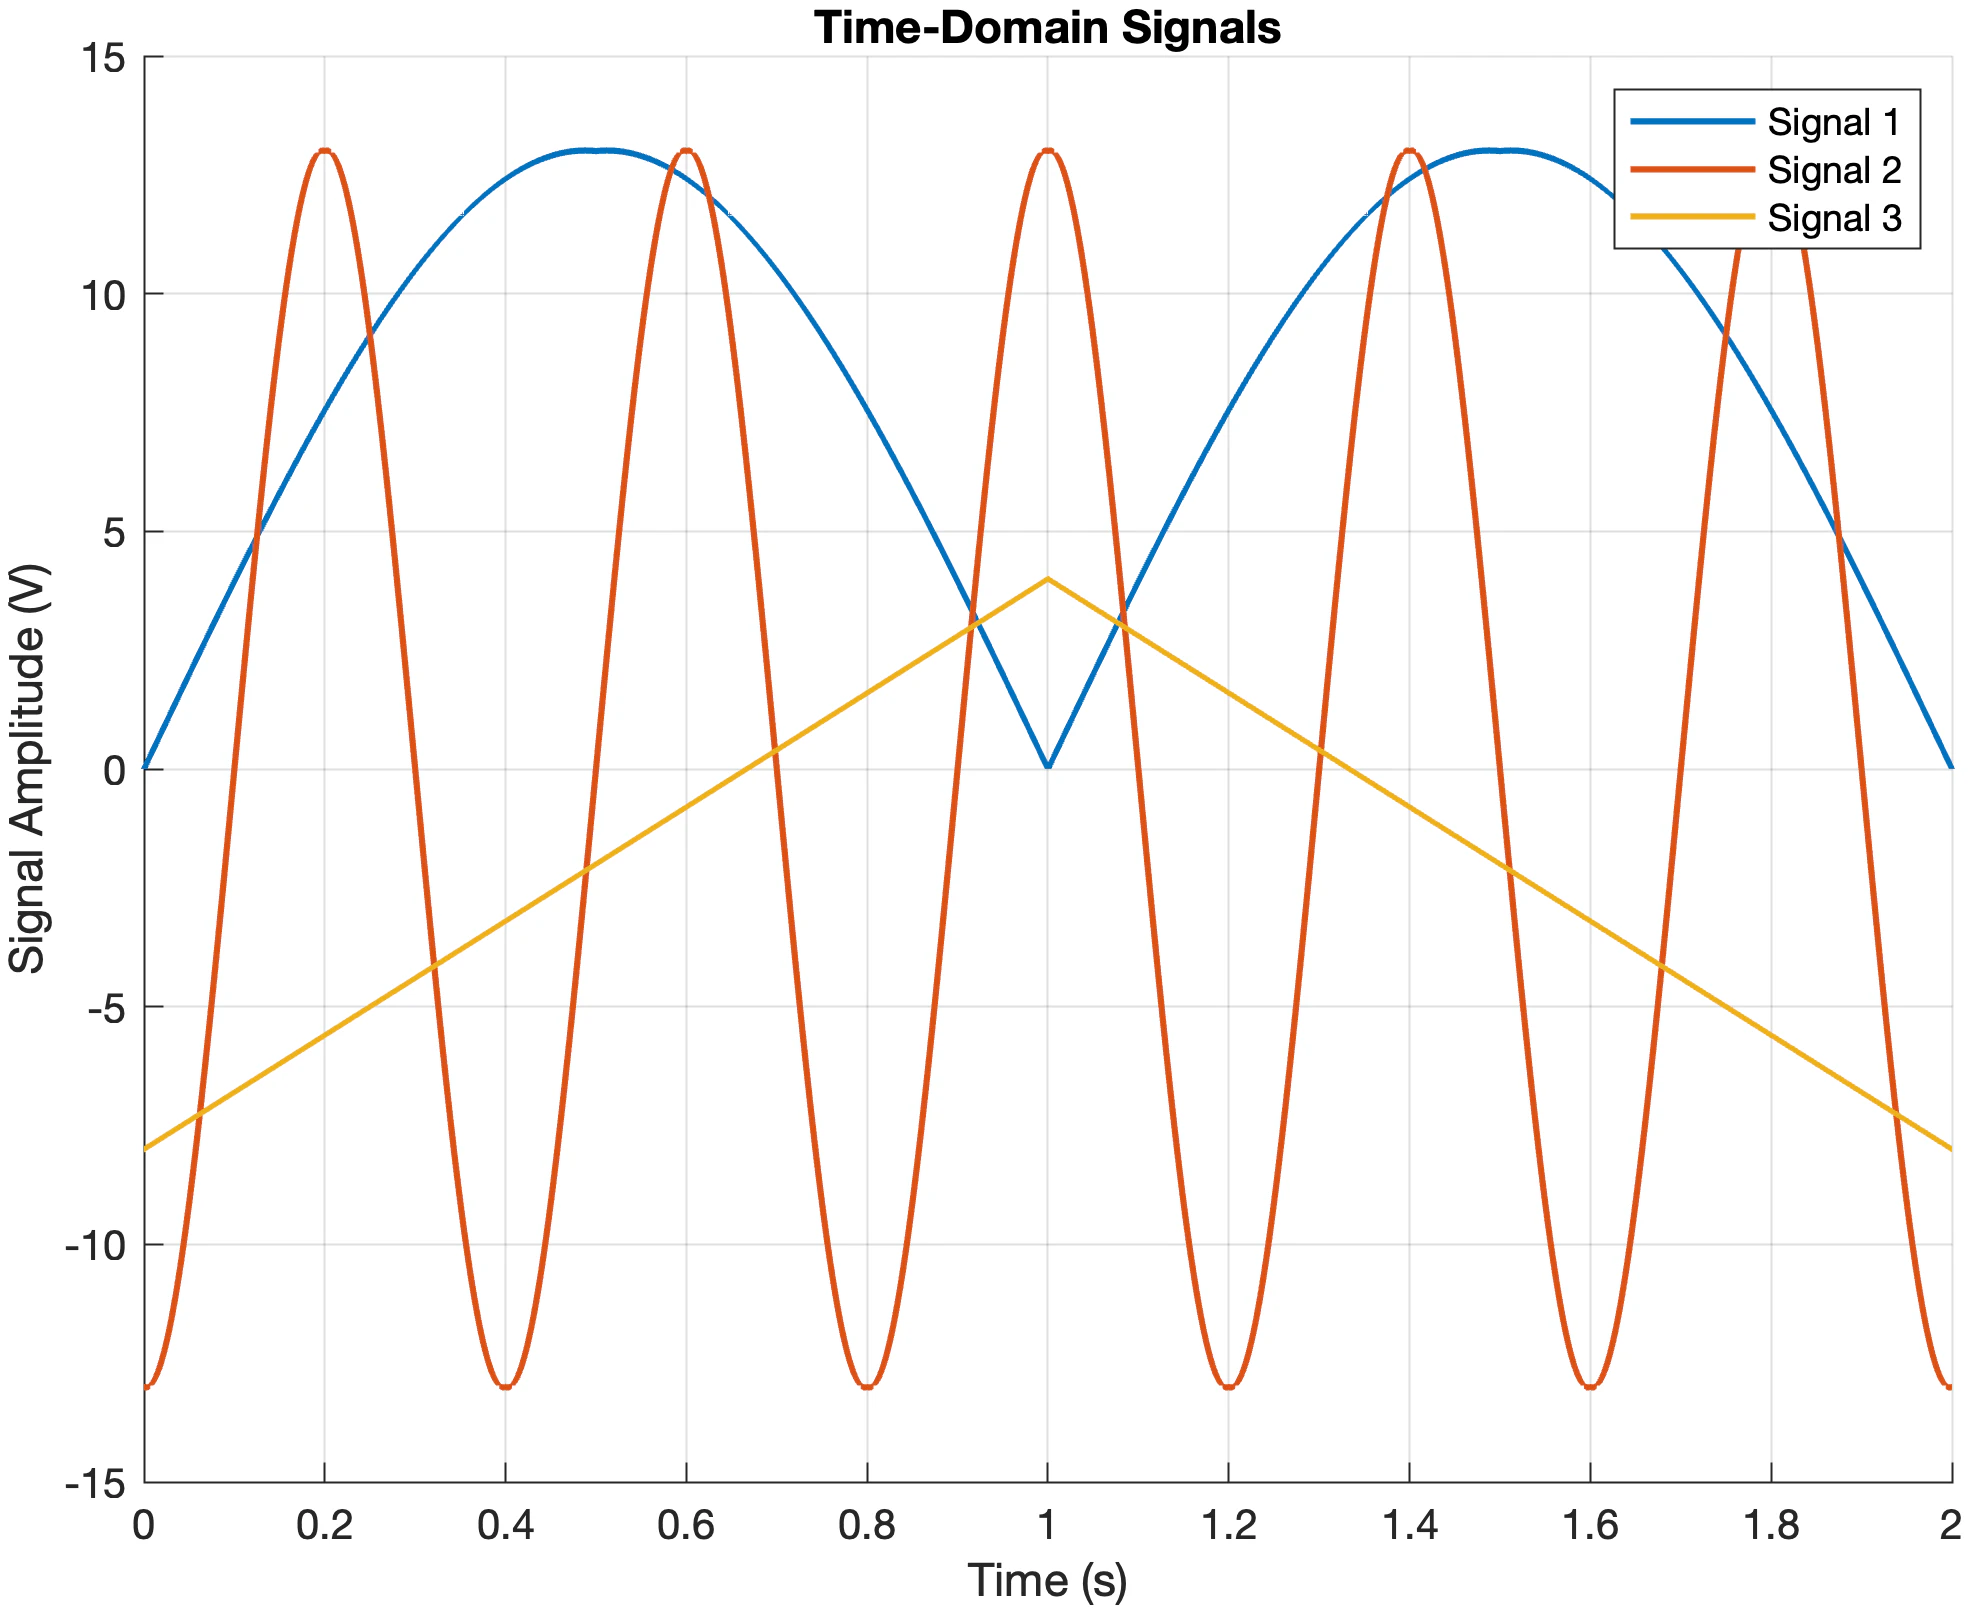
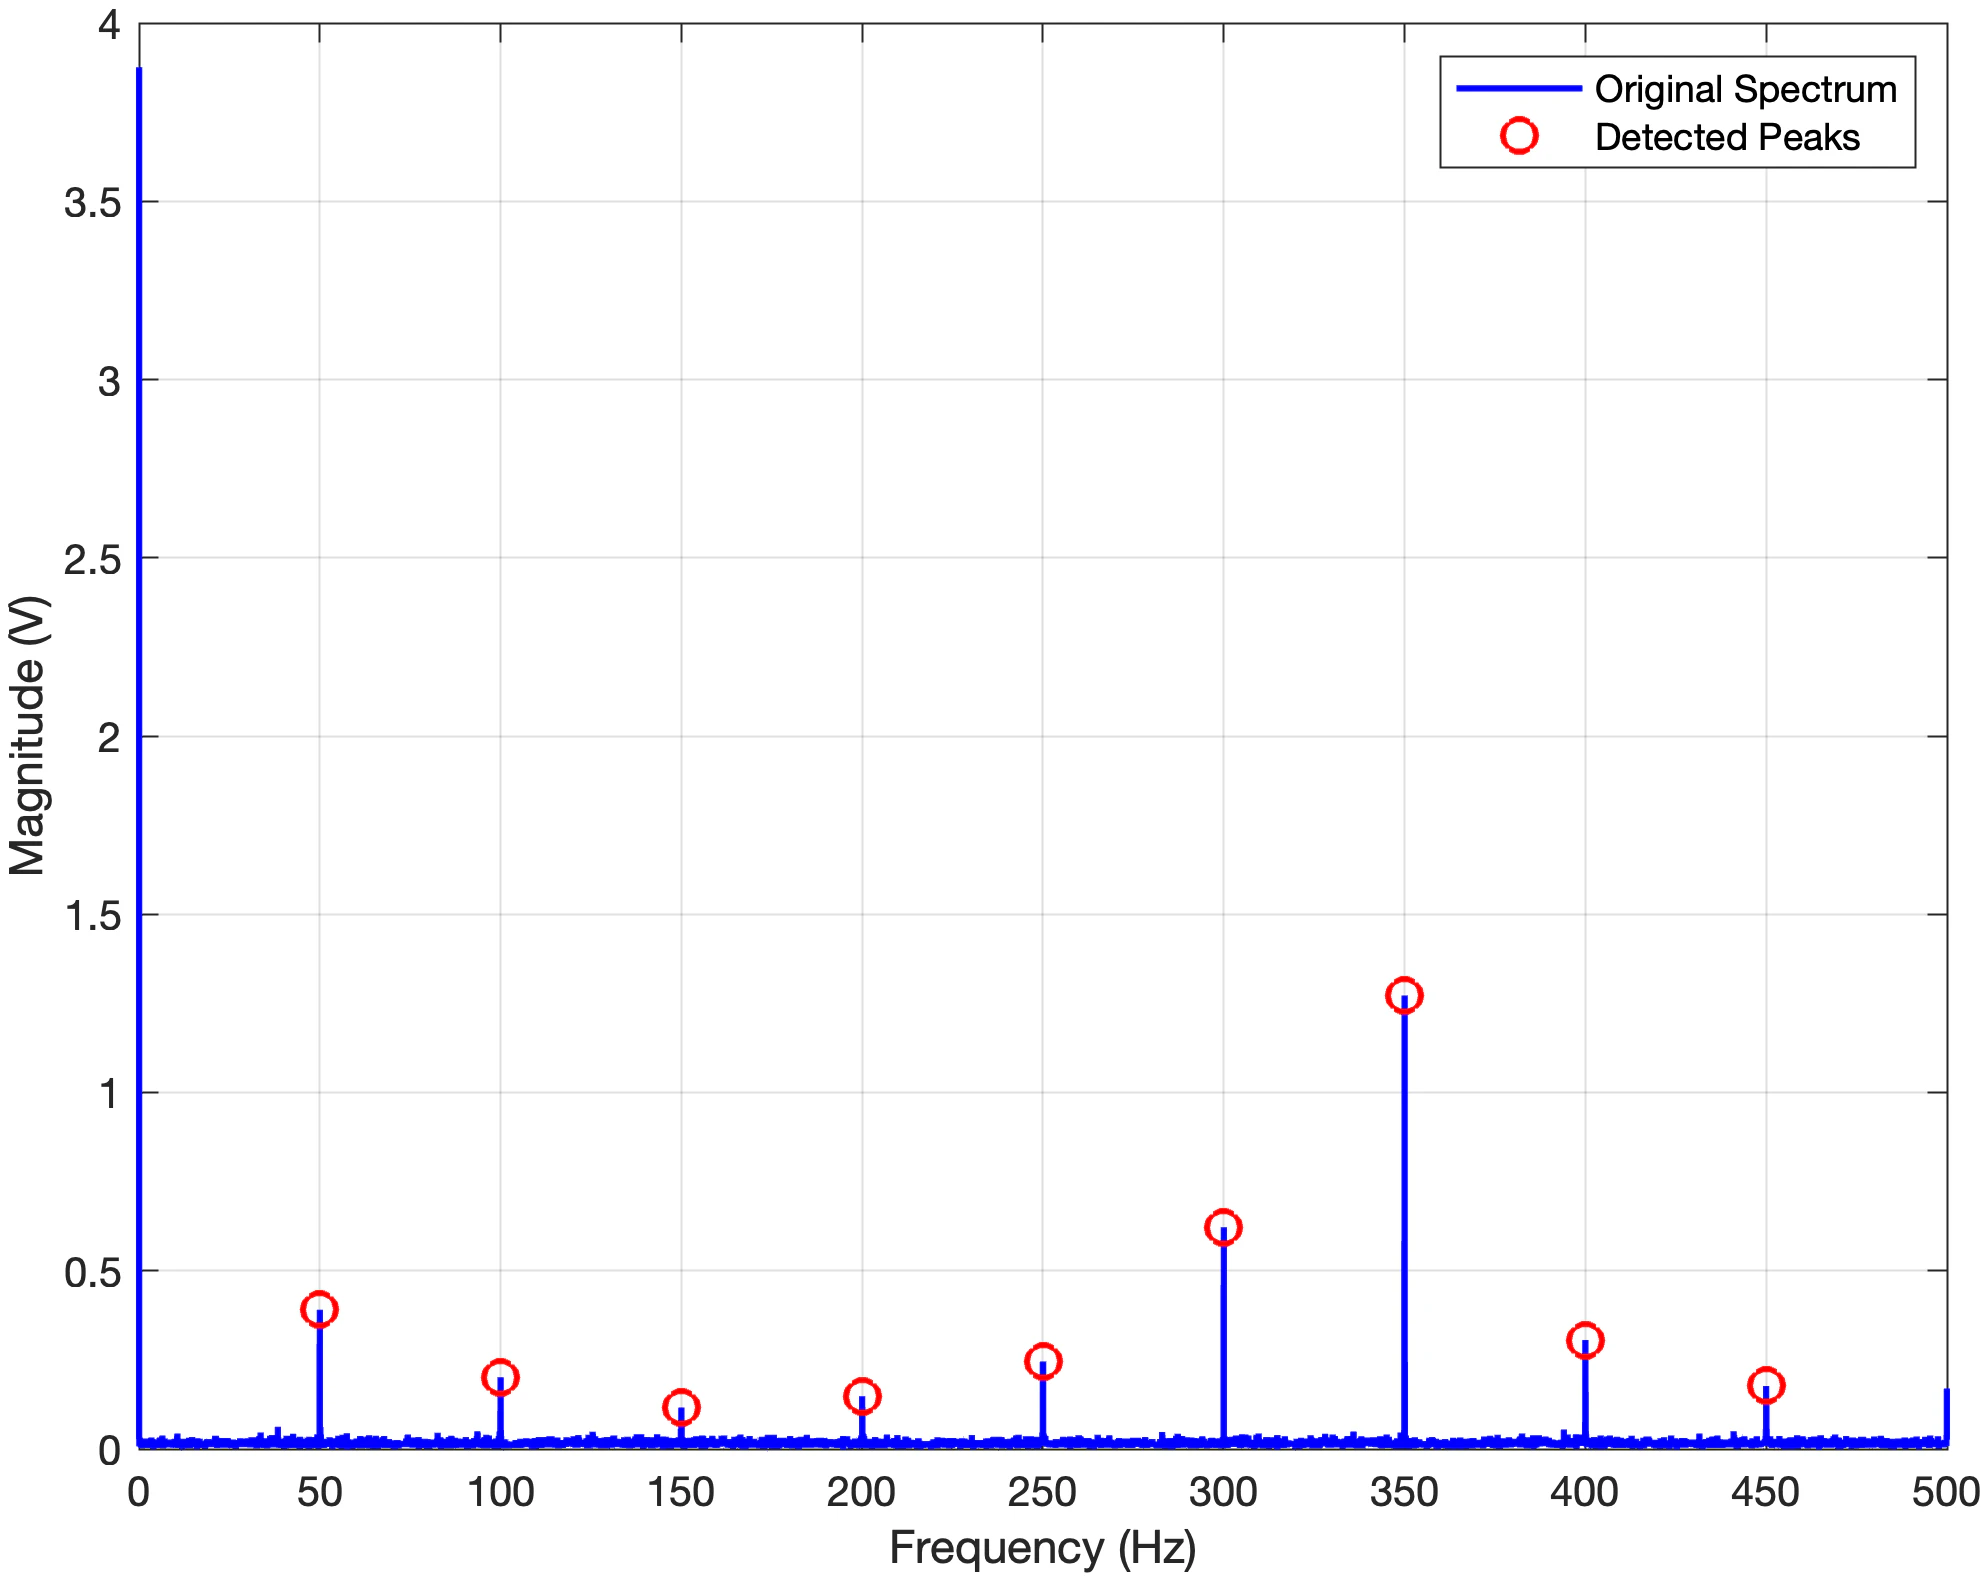
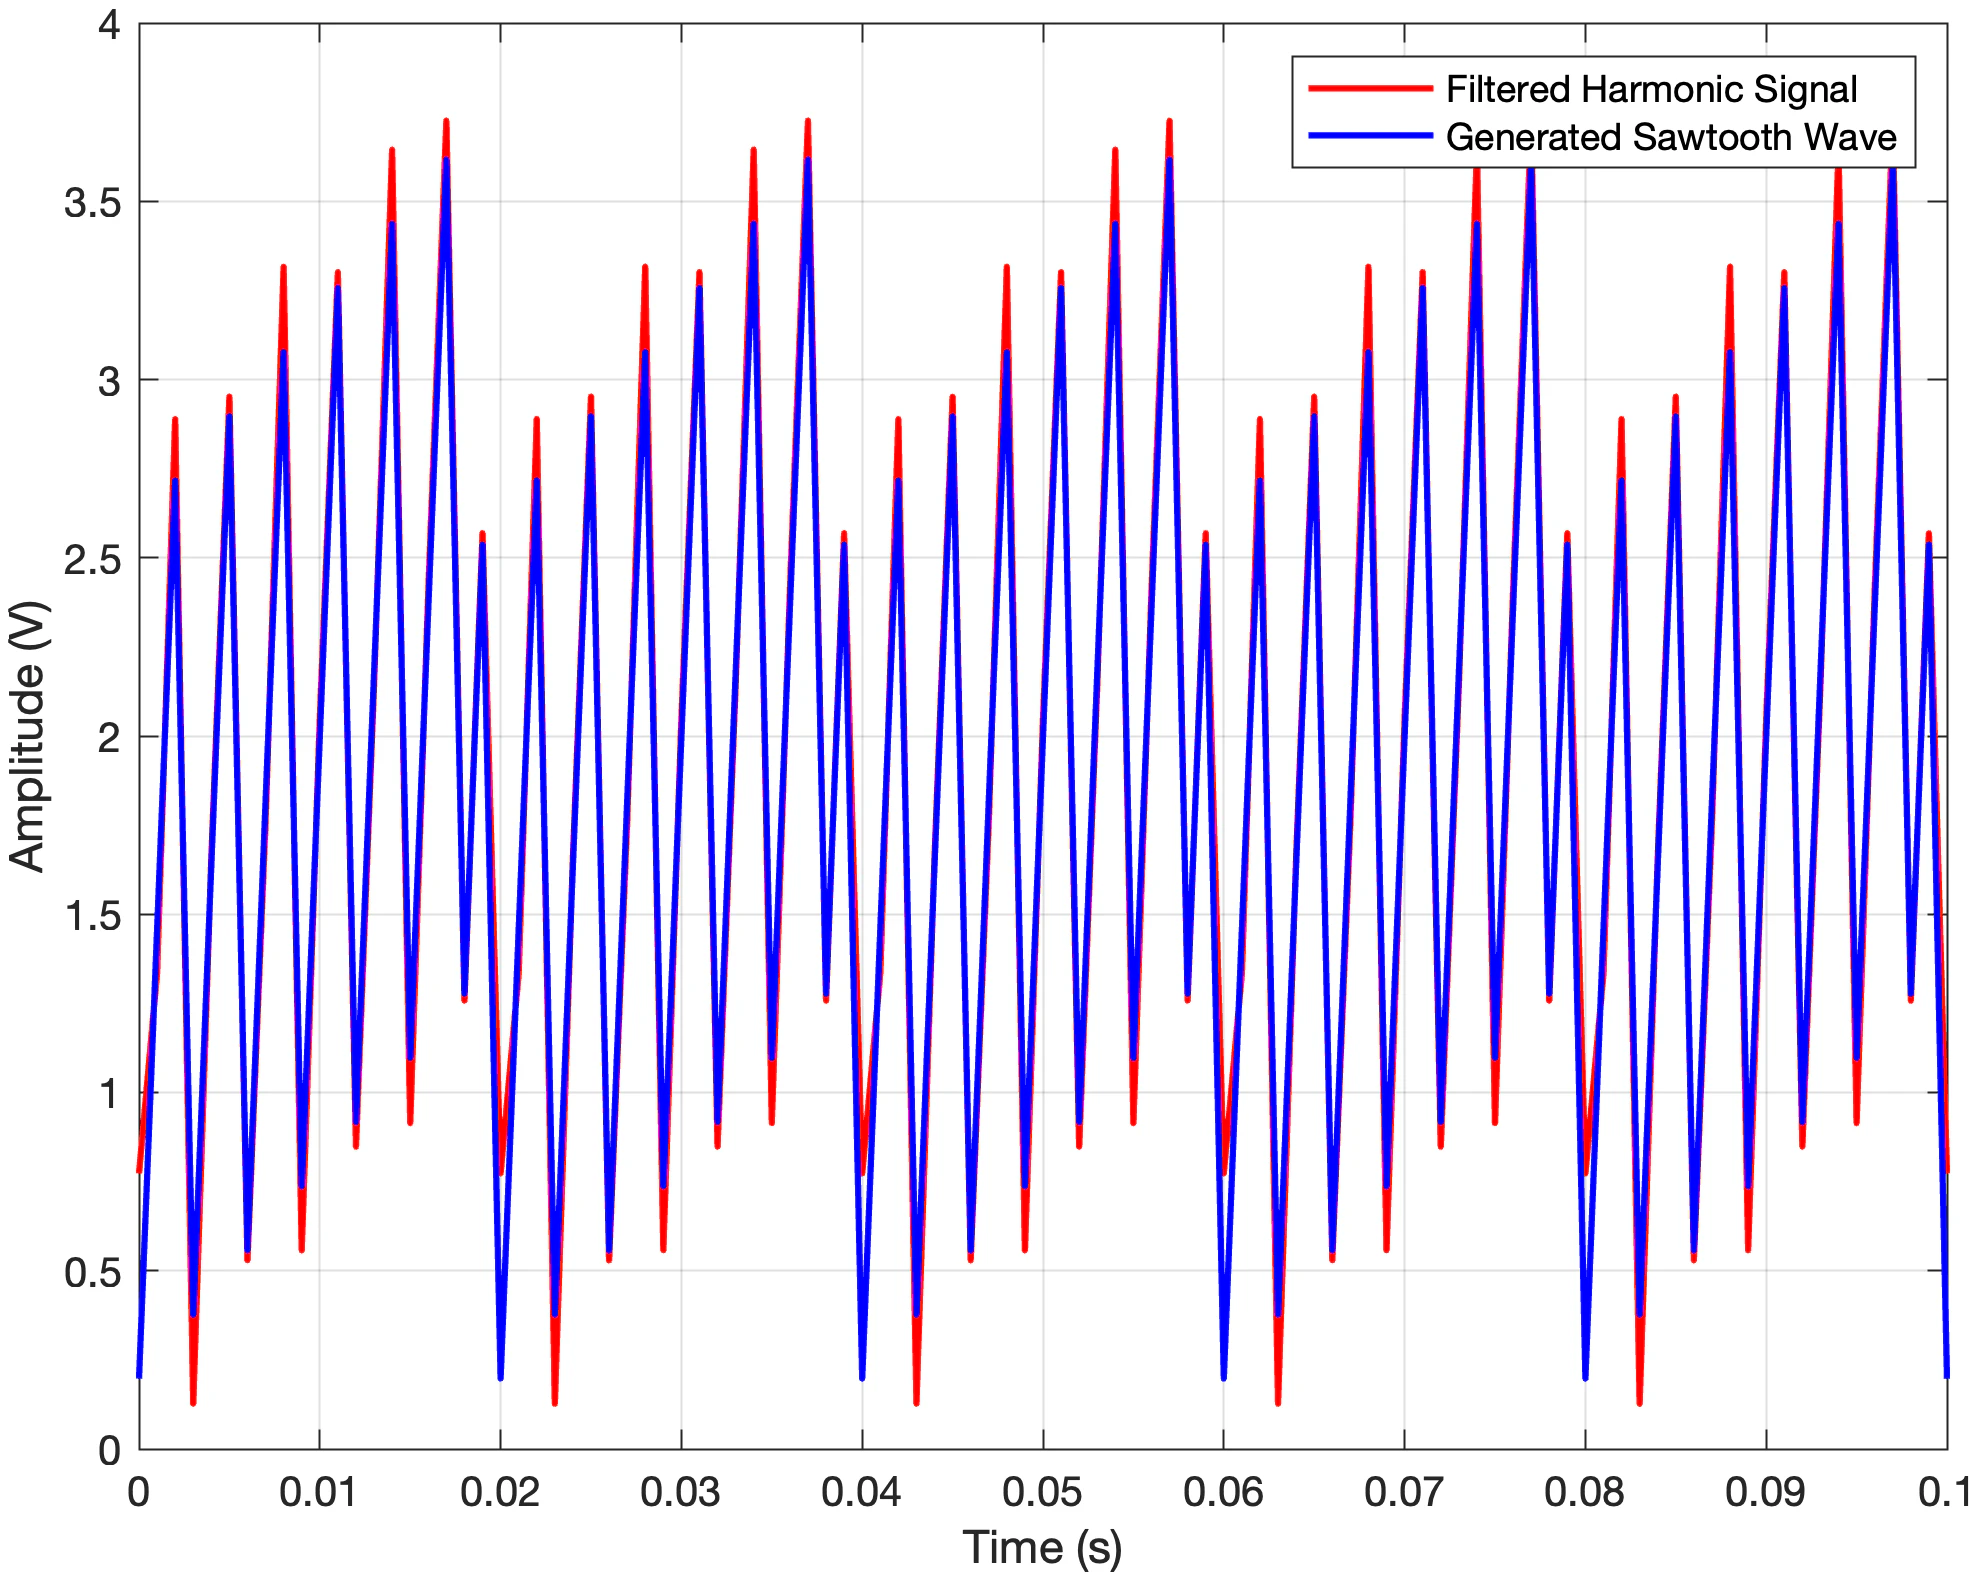
Three triangular waves through a suspect amplifier were characterised by mean, variance, skewness, kurtosis and RMS. The reading: the amplifier clips whenever the signal power exceeds its rating, and a bias clips positive peaks earlier than negative ones. A second record sampled at 1 kHz showed harmonics of a 350 Hz fundamental folded back by aliasing. Keeping only the spectral peaks and inverting the FFT recovered a clean waveform that matched a generated sawtooth.
Control tuning
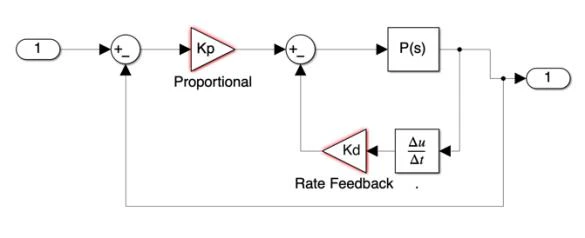
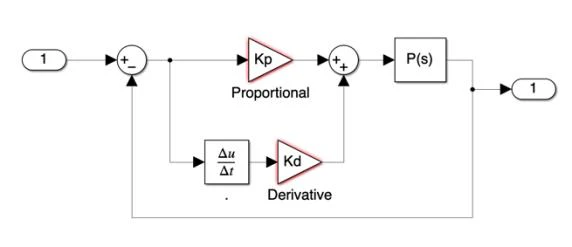
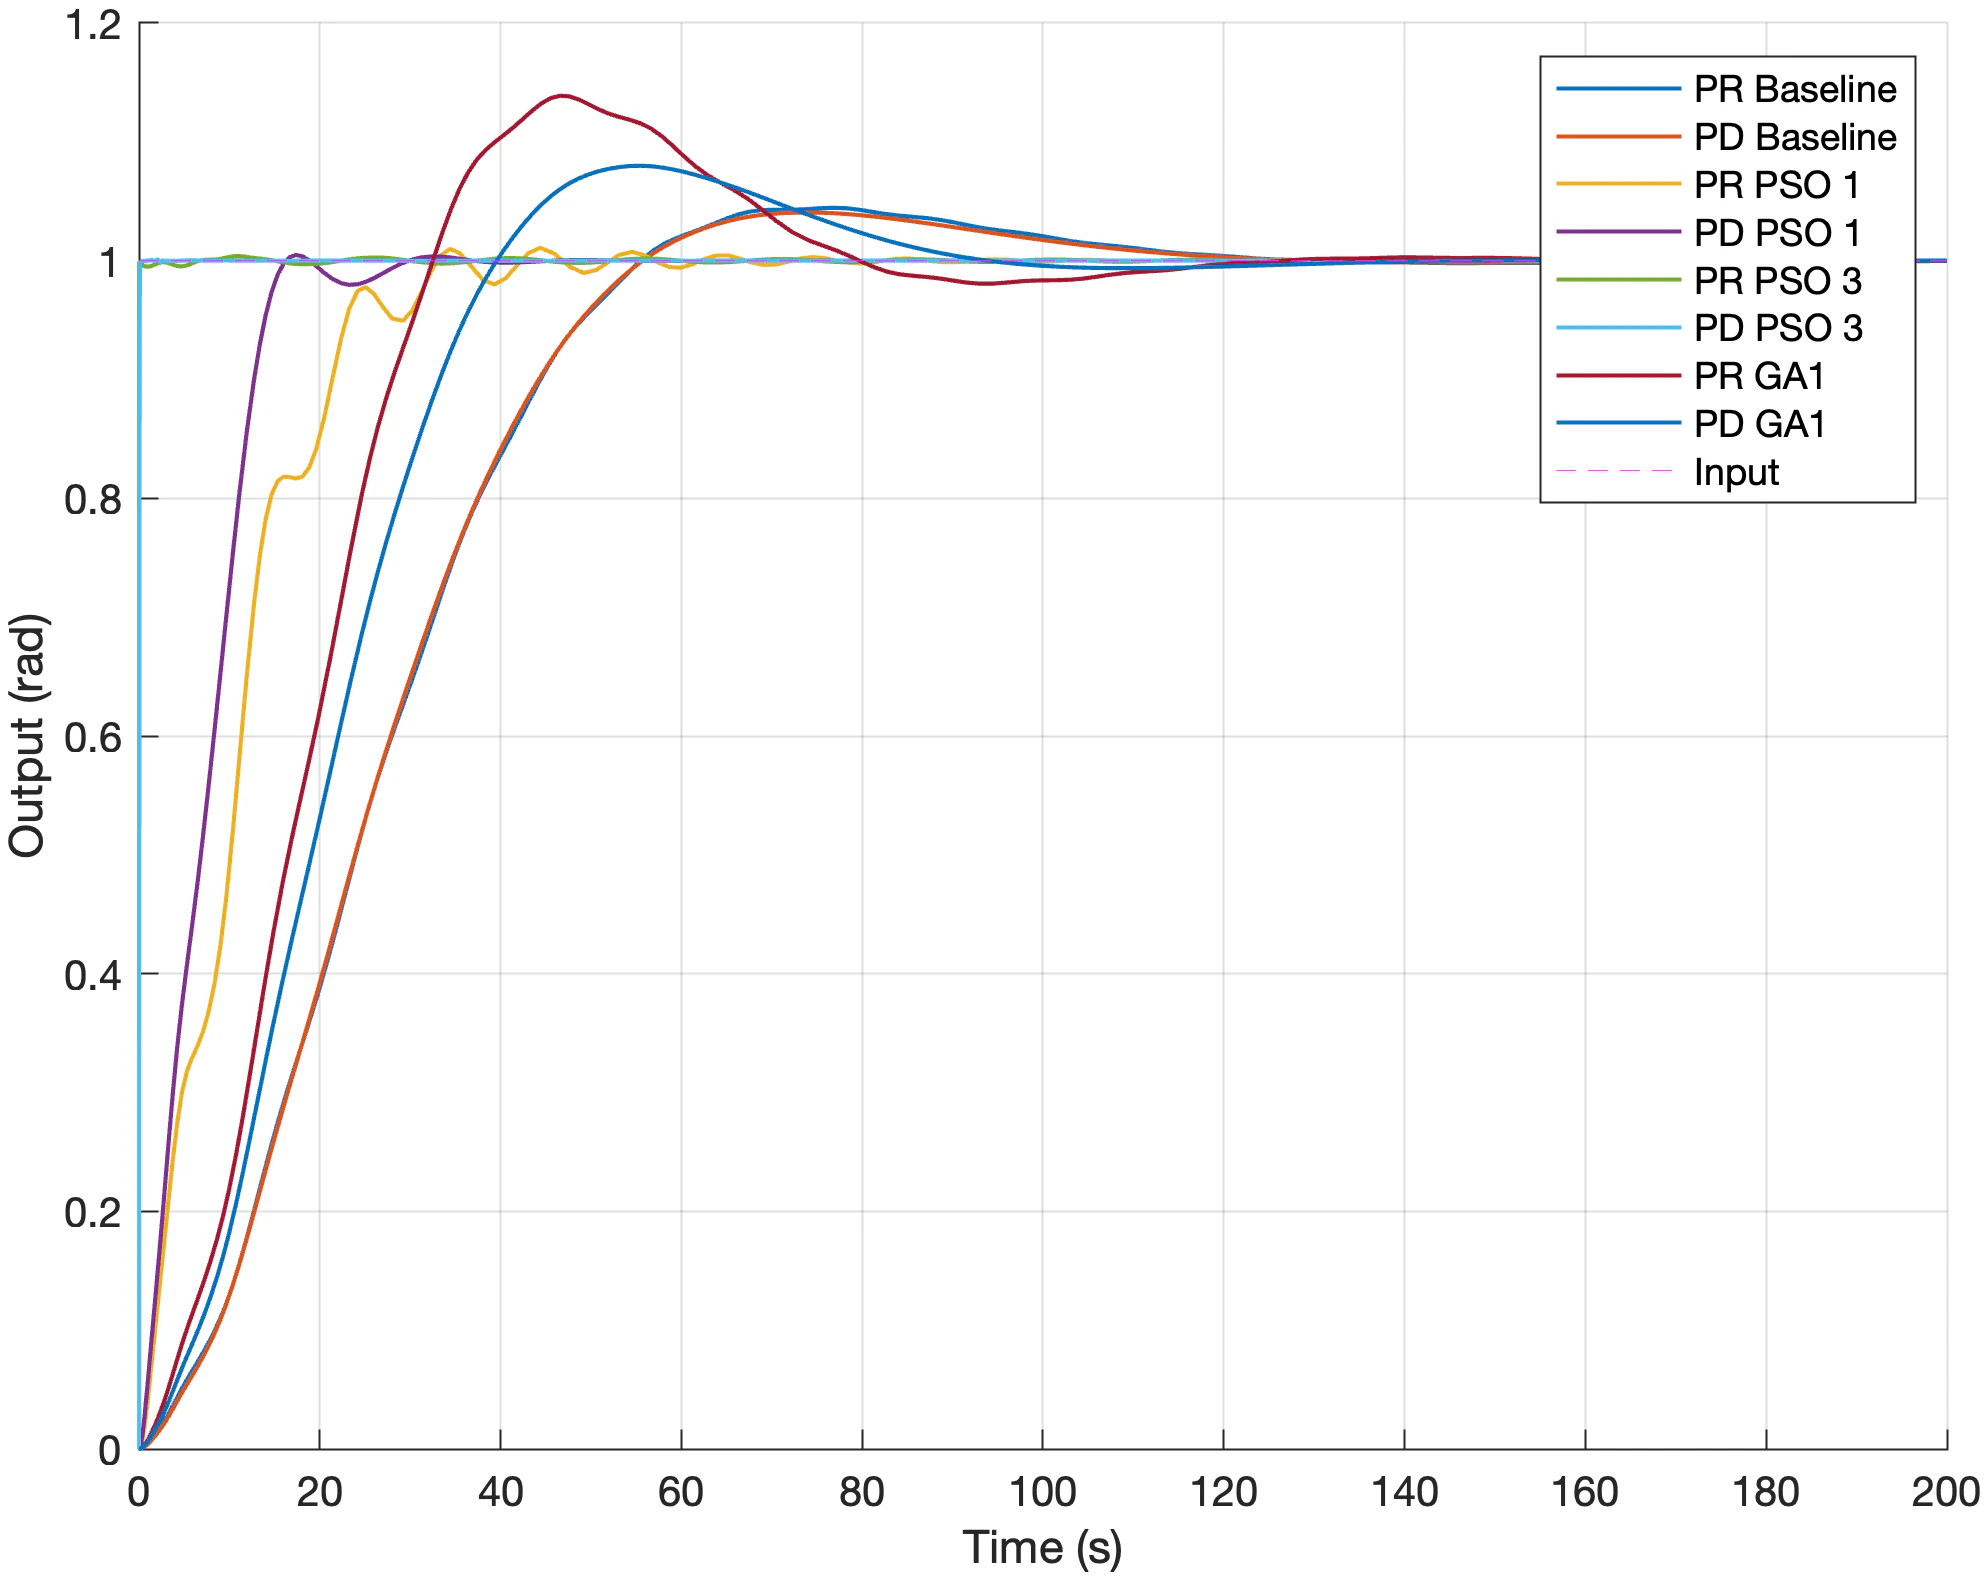
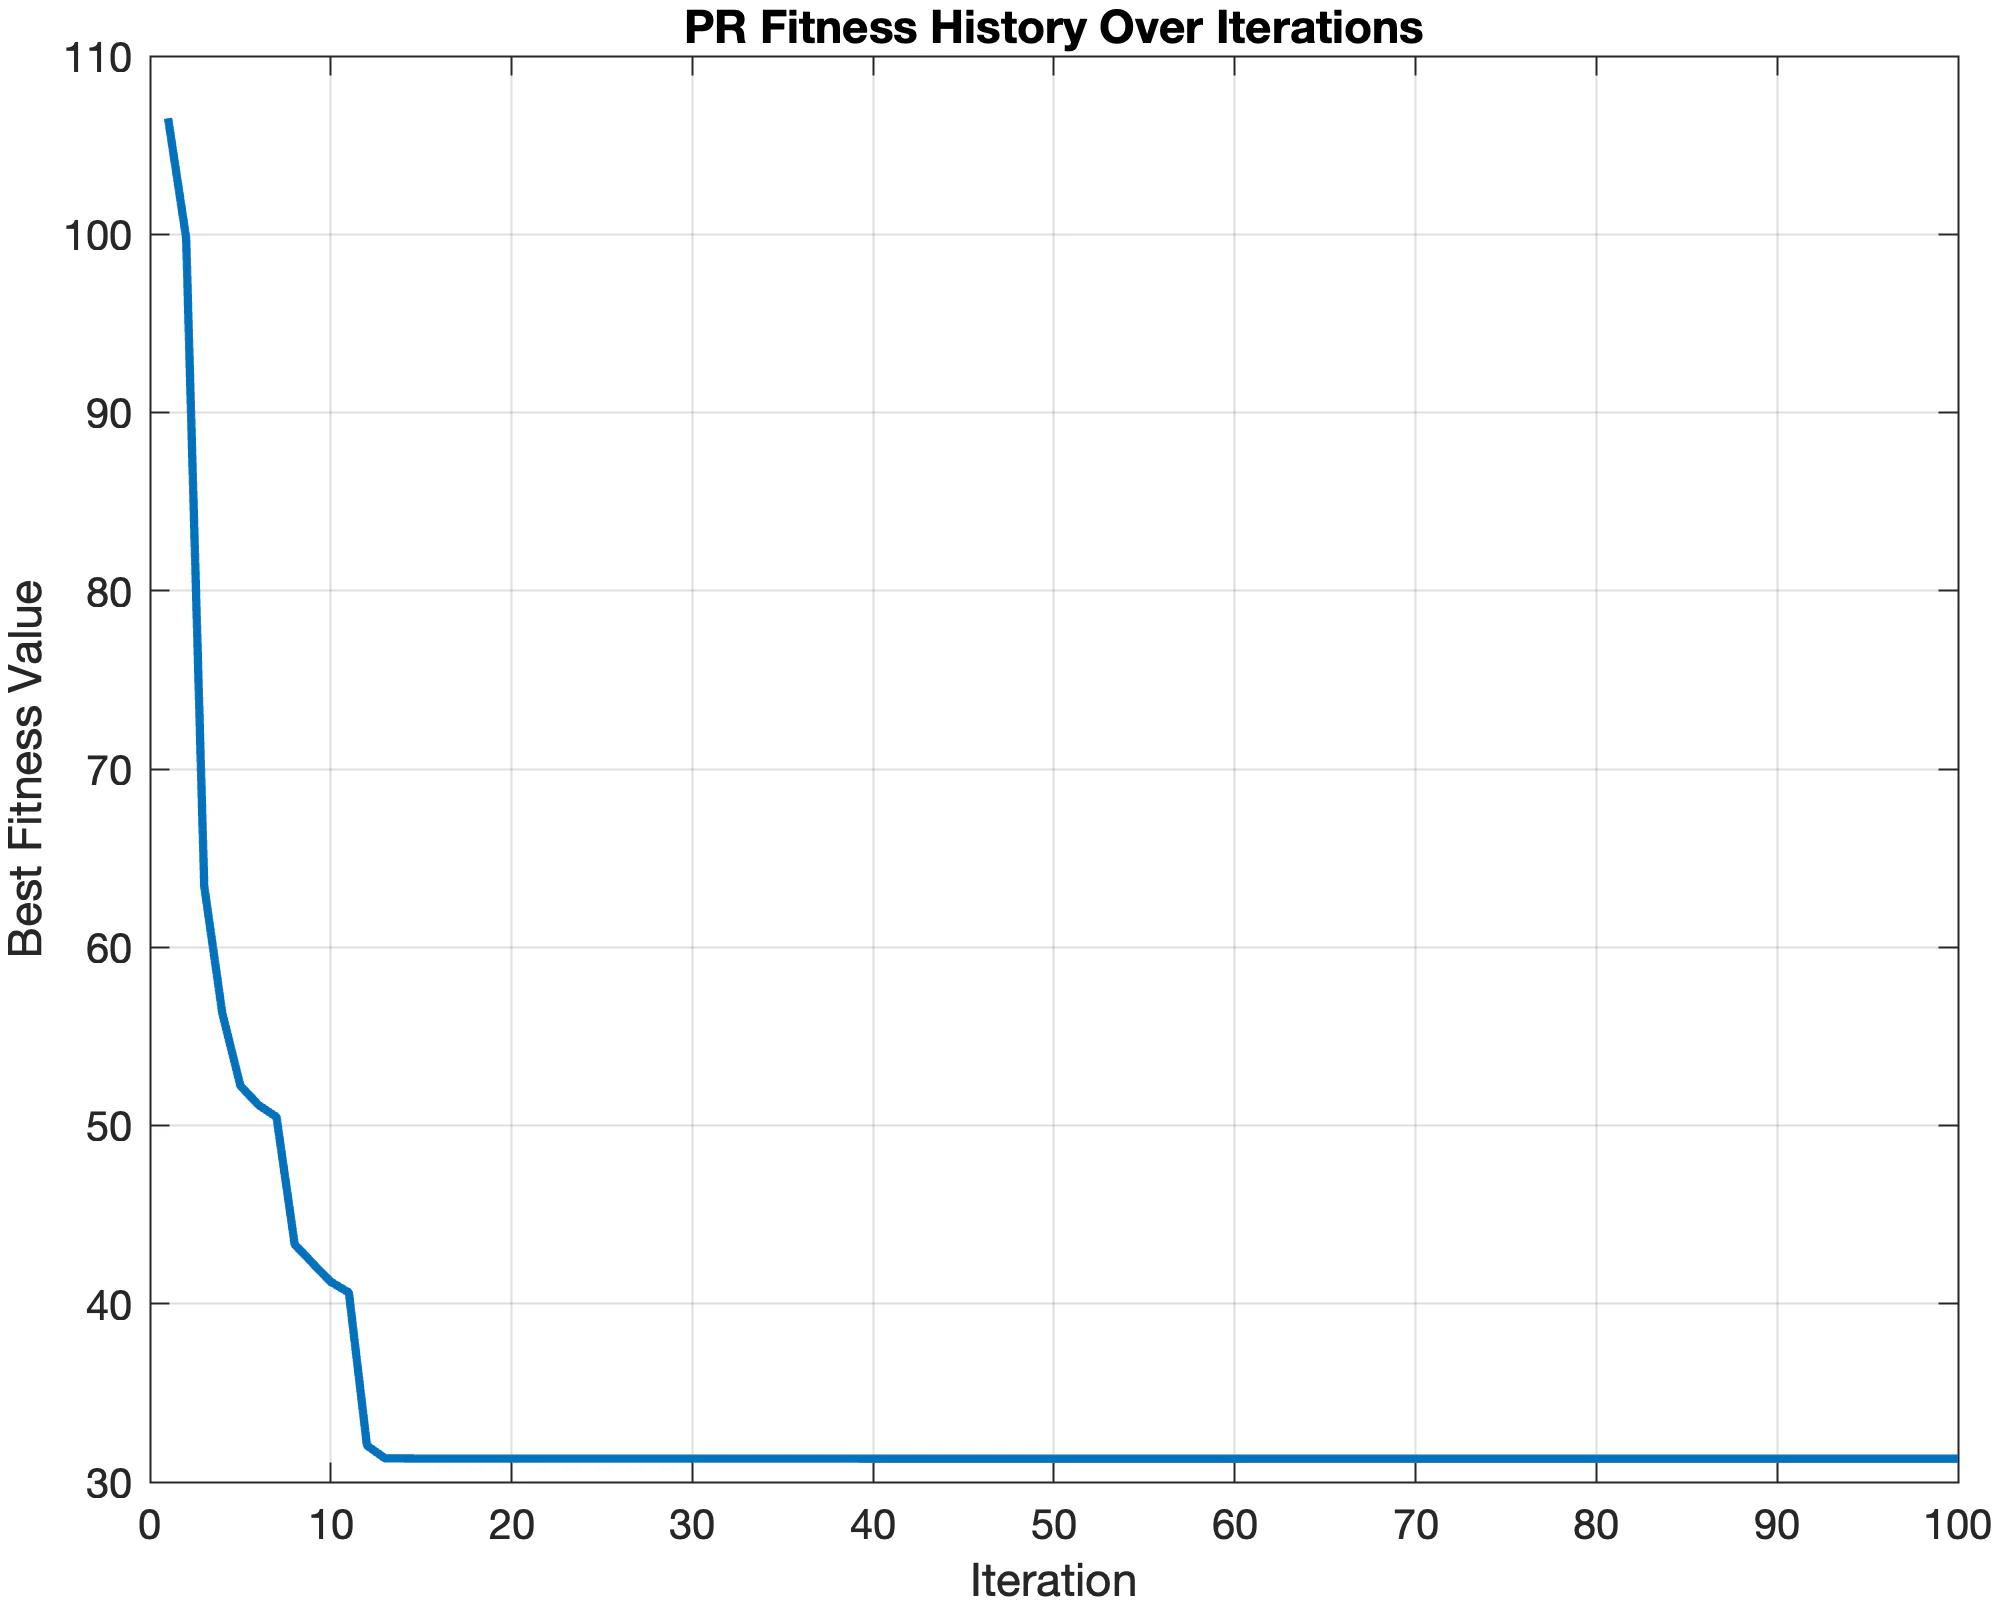
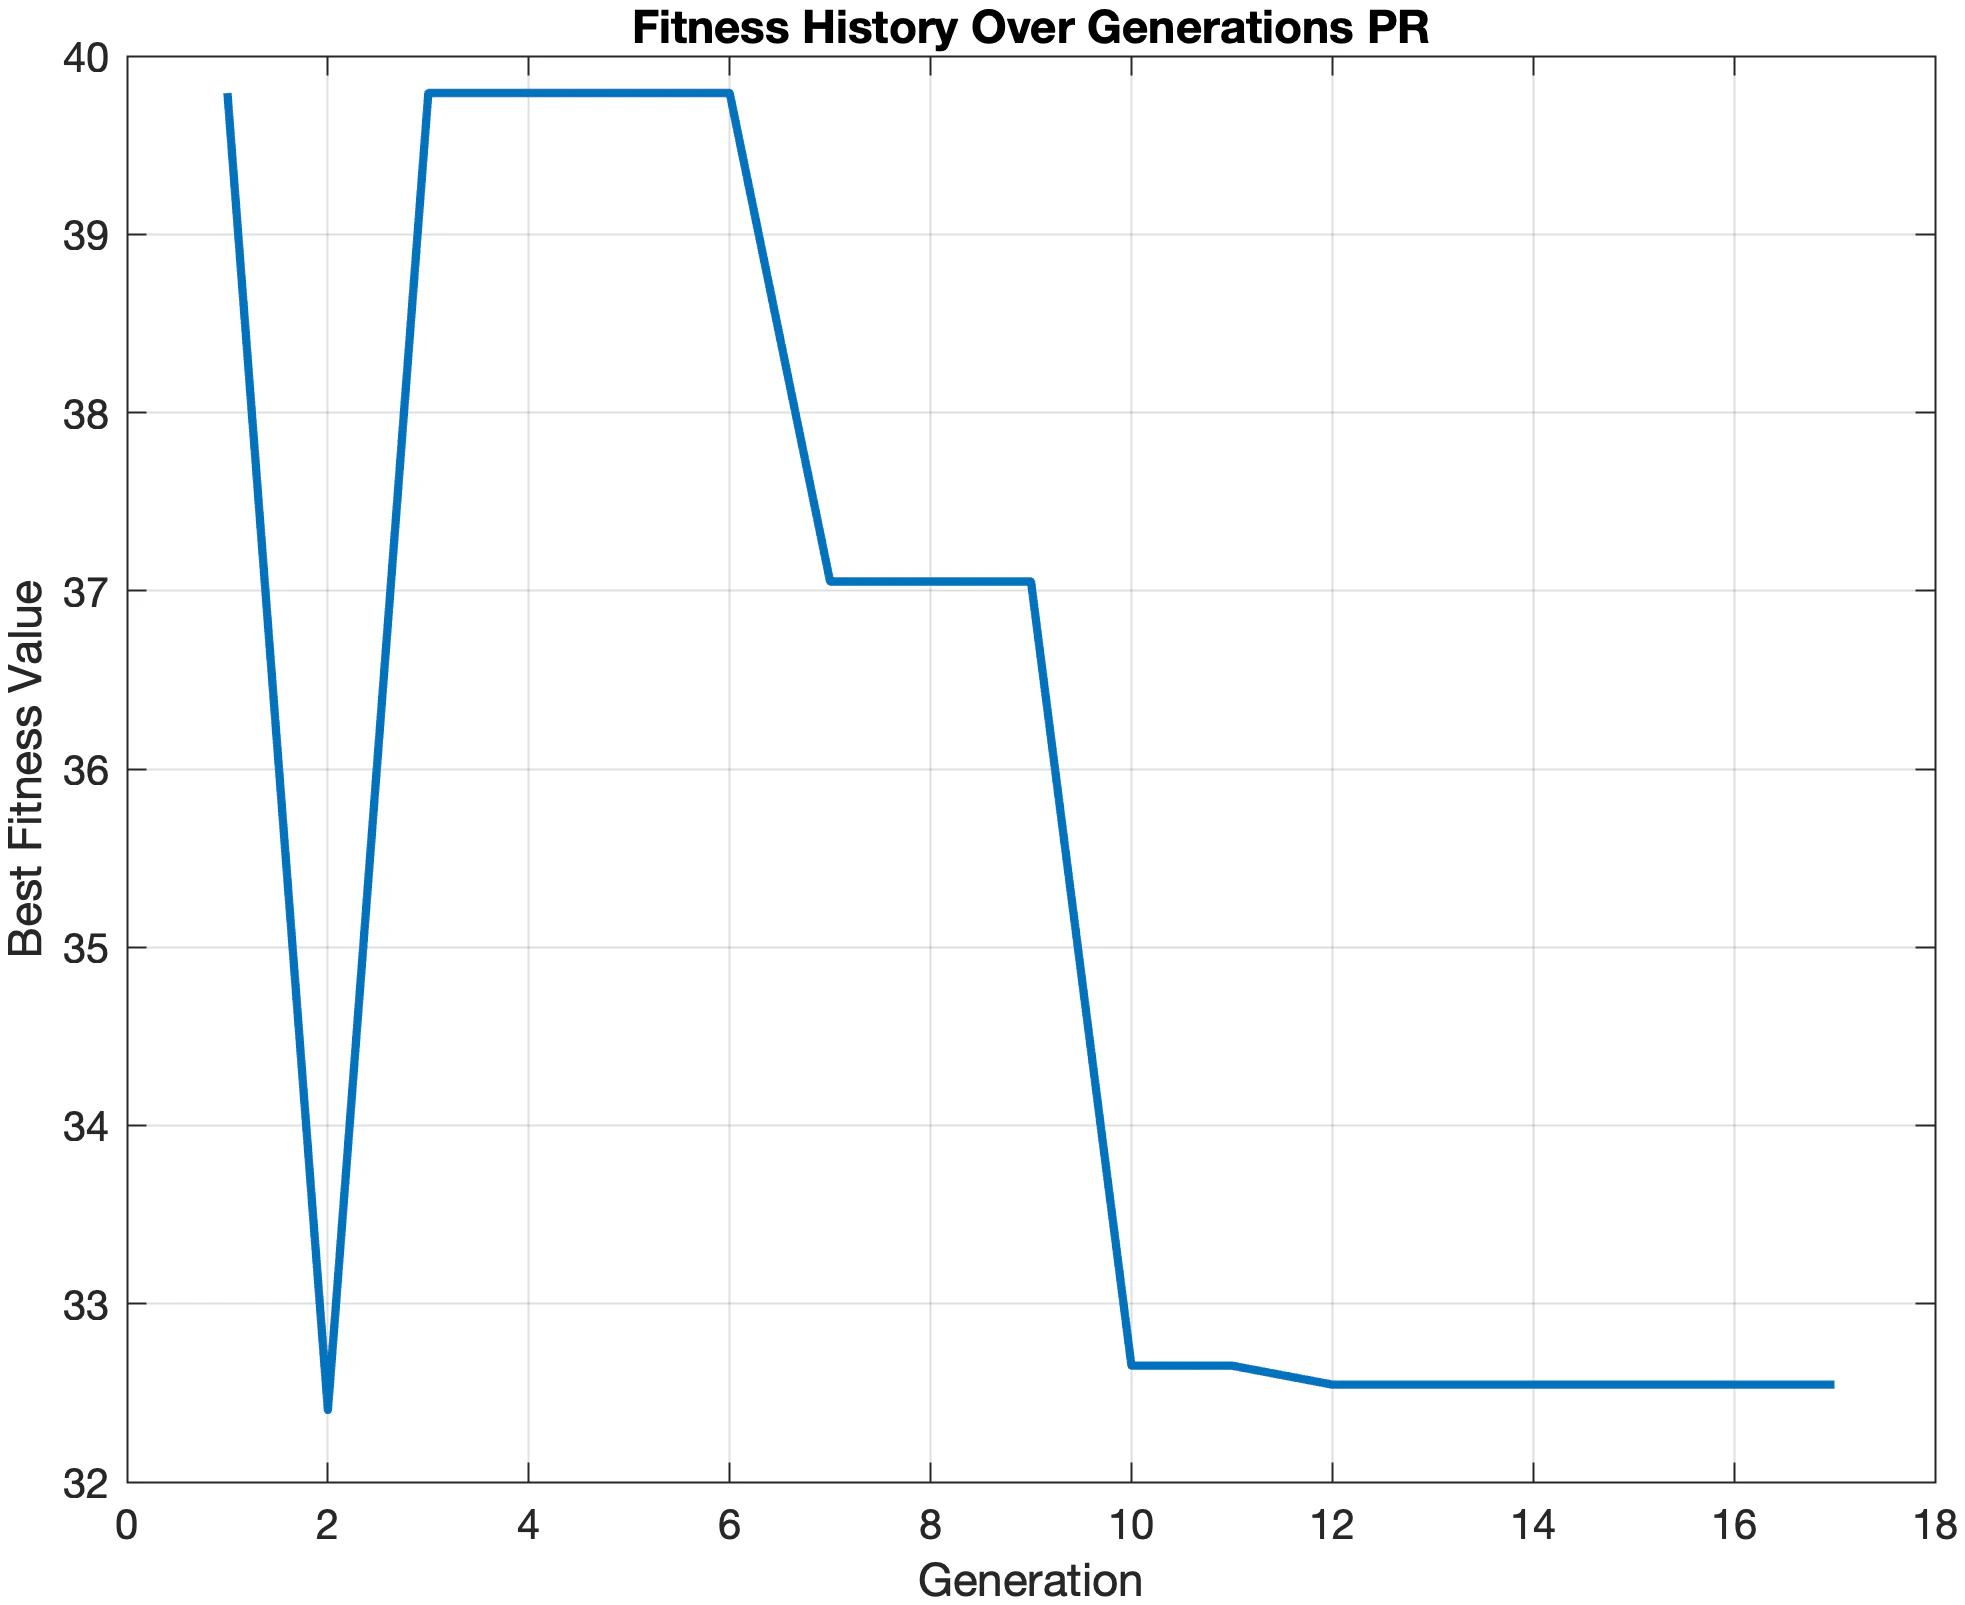
Proportional-plus-rate-feedback and proportional-derivative controllers were built in Simulink around the spacecraft plant and scored on a single cost: steady-state error weighted a thousandfold, plus overshoot, settling time and rise time. Ten tunes were compared. Characteristic-equation matching to the suggested 0.06 rad/s and 0.707 damping gave the baseline. Manual and Ziegler-Nichols searches were automated. A genetic algorithm and a particle swarm optimiser were written from scratch, each driving the Simulink model from its cost function. The swarm converged fastest and cut the PR cost from 141 to 0.44. The catch, noted in the report, is that its very high gains ring at high frequency as they settle, which could excite the flexible appendages.
Report
The full coursework report: the flutter root locus, the signal-processing tasks and the controller tuning, with the GA and PSO code described.