Nosecone CFD
Codename ARIA V&VDensity-based OpenFOAM simulation of the ARIA sounding-rocket nosecone at Mach 1.8, validated against NACA wind-tunnel data to within the tunnel's own uncertainty.
The inherited target was wrong
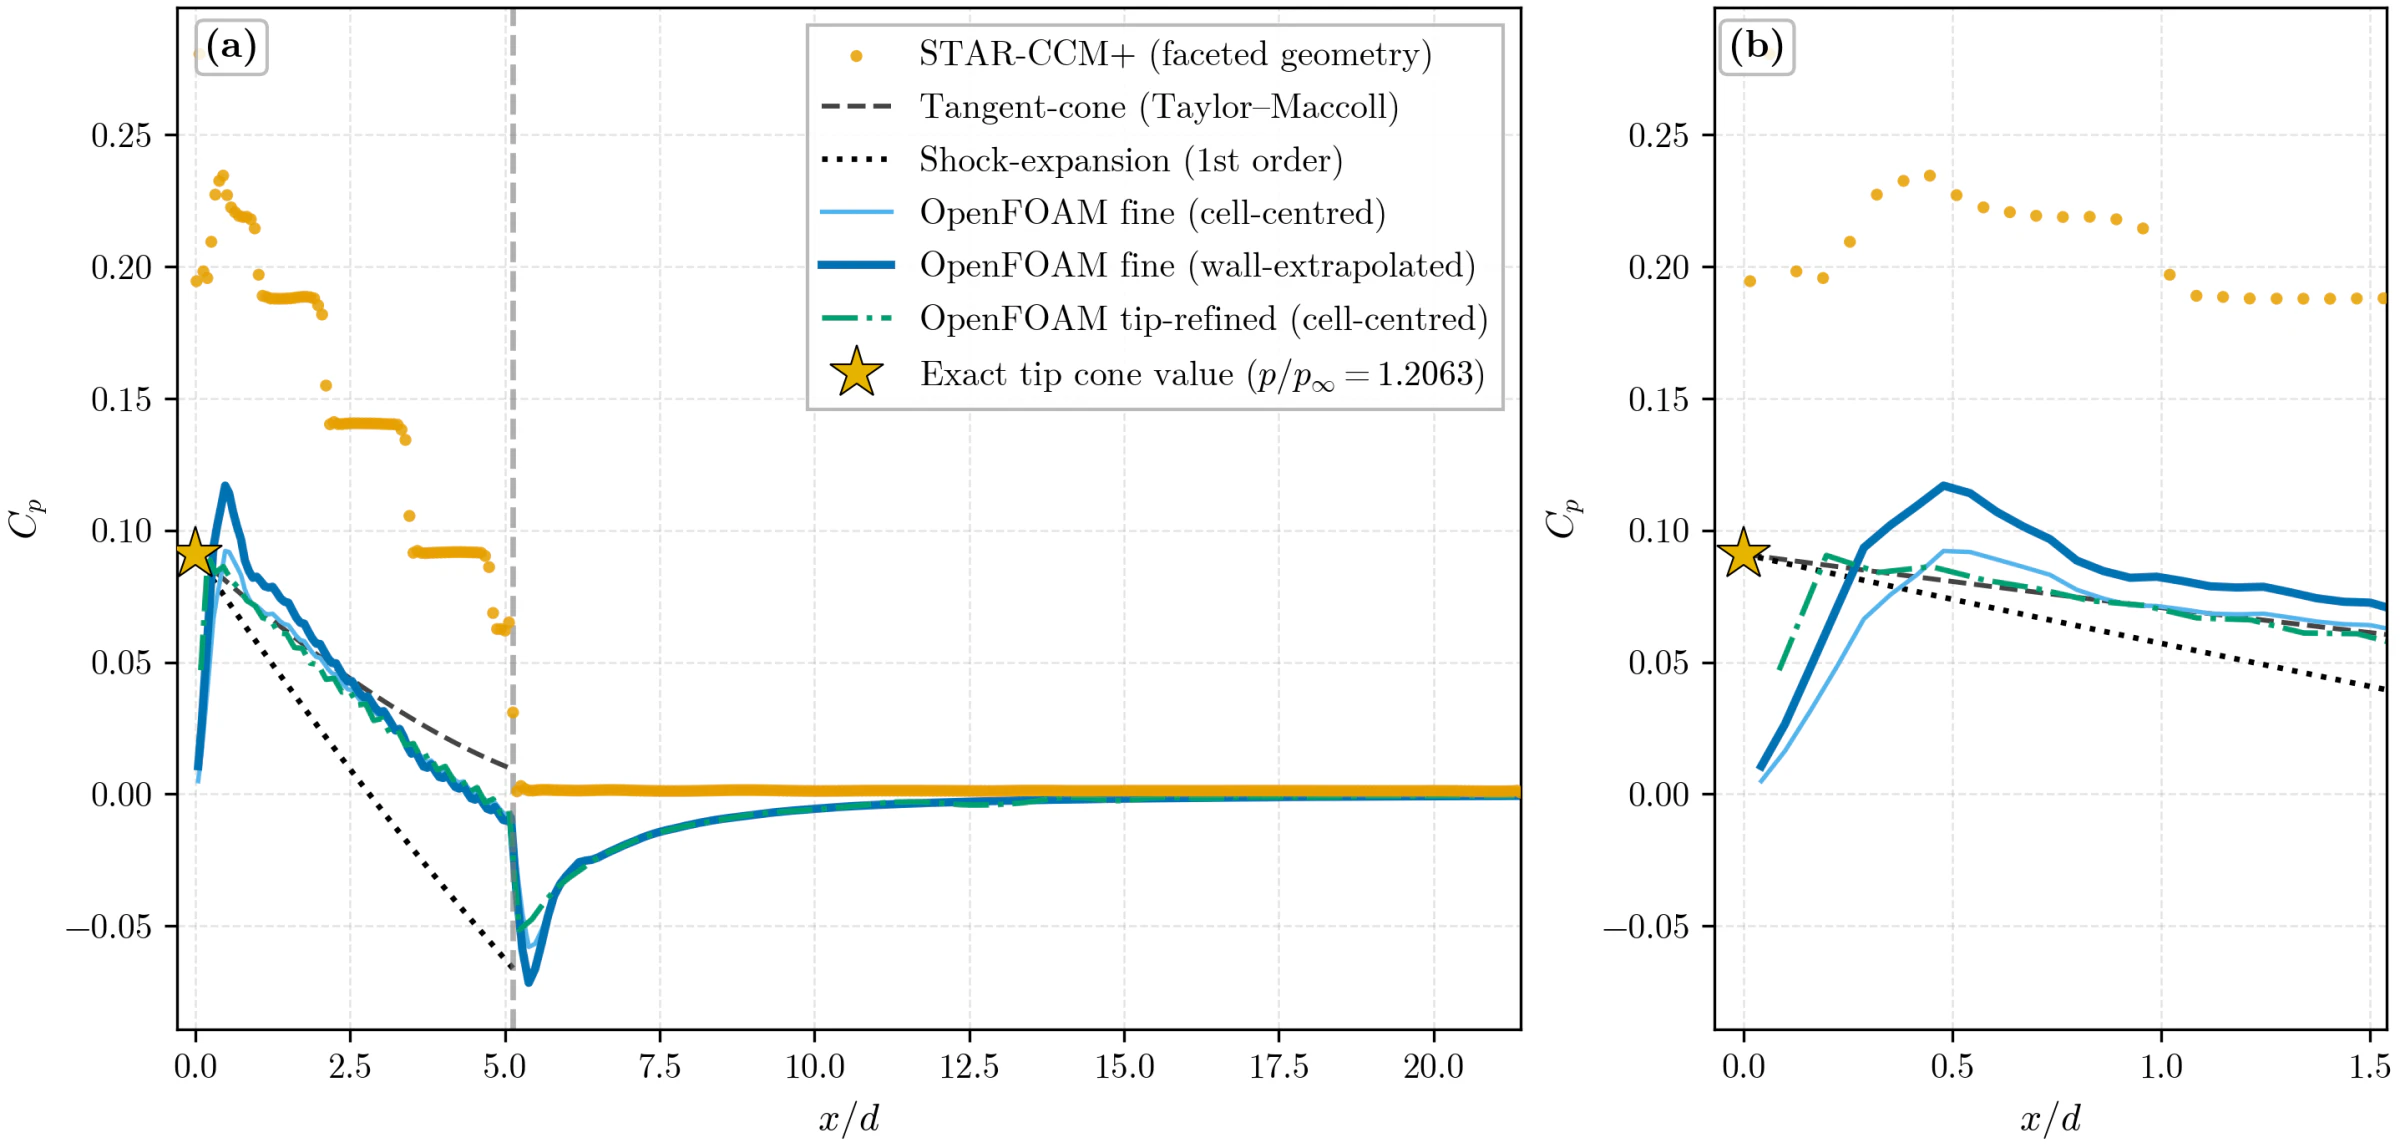
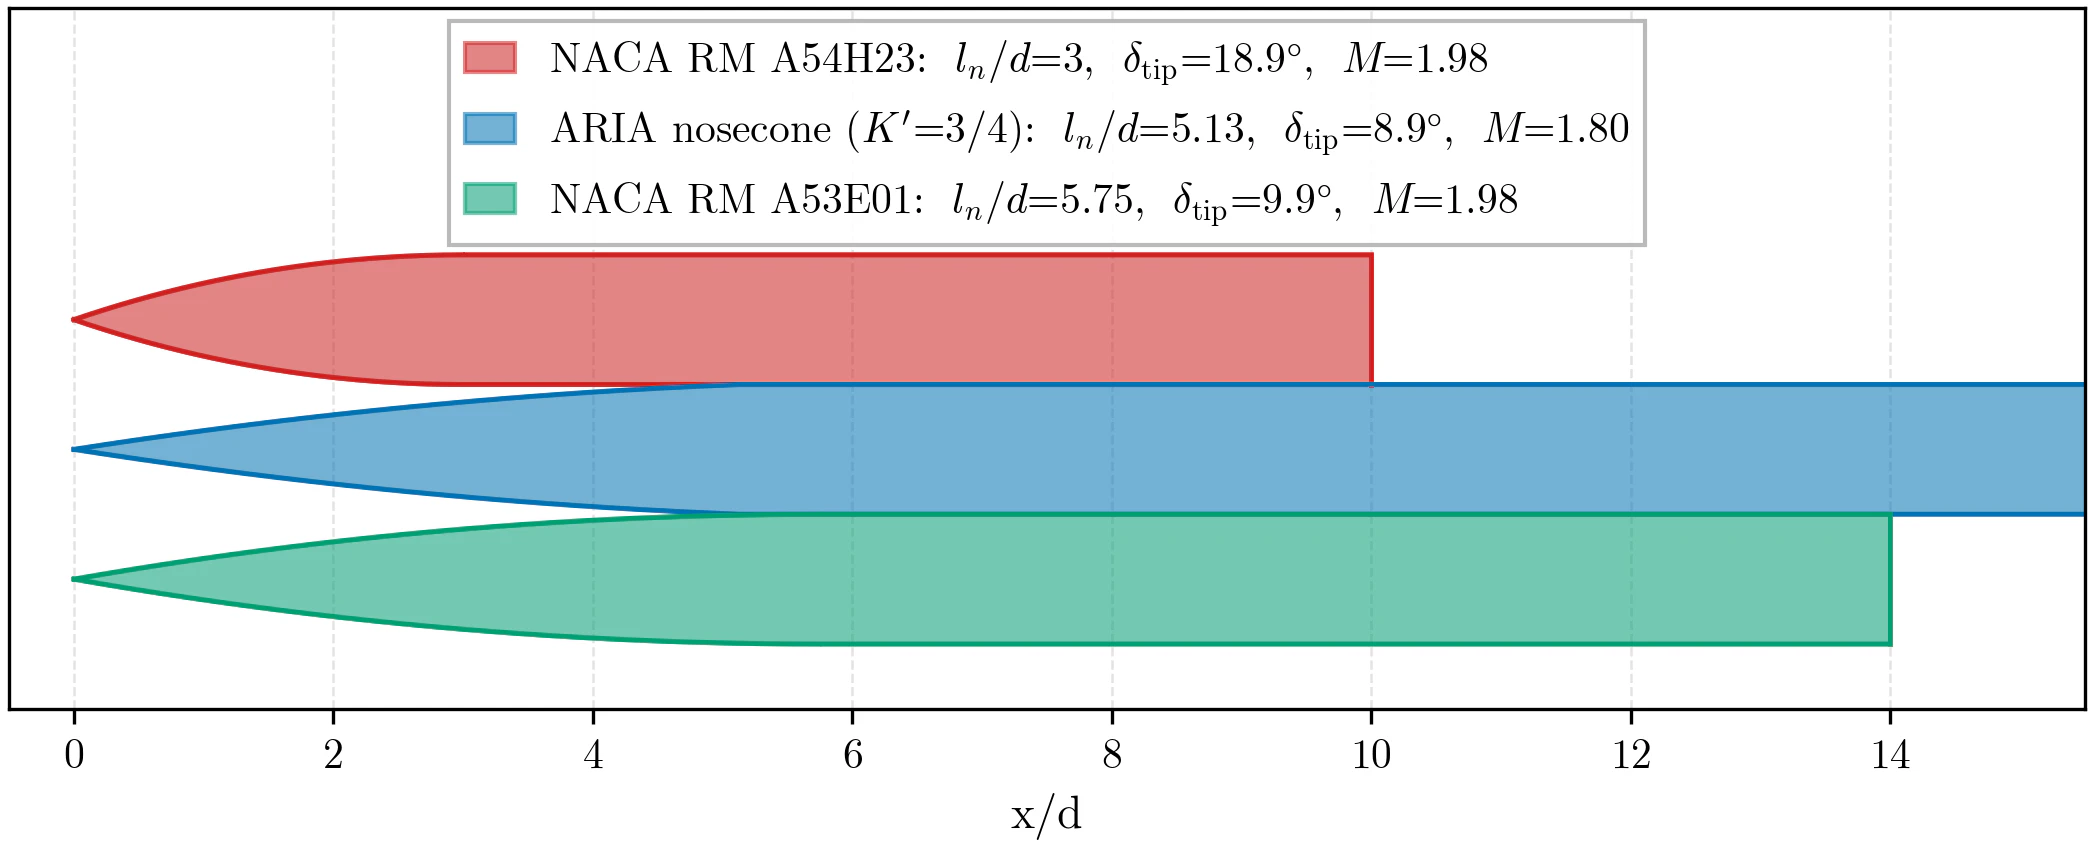
I inherited a handoff comparing OpenFOAM to STAR-CCM+ with a 23.3 % tip-pressure discrepancy and a tip target of p/p∞ = 1.860. The first job was an audit. The ARIA nose is not a tangent ogive: all 21 design coordinates fit the parabolic-series profile r = 0.156x − 0.14625x² (K′ = 3/4) to a residual of about 1e-17 m, tip half-angle 8.87°.
Exact Taylor-Maccoll for that tip at M = 1.8 gives p/p∞ = 1.206, not 1.860; the target had been transcribed from the NACA body at M = 1.98. The fine-grid apex lands within +0.2 % of exact. The discrepancy was a near-wall sampling artifact plus STAR-CCM+'s faceted geometry over-predicting the tip region by 2.8×. STAR-CCM+ was the outlier.
Validated against wind-tunnel data
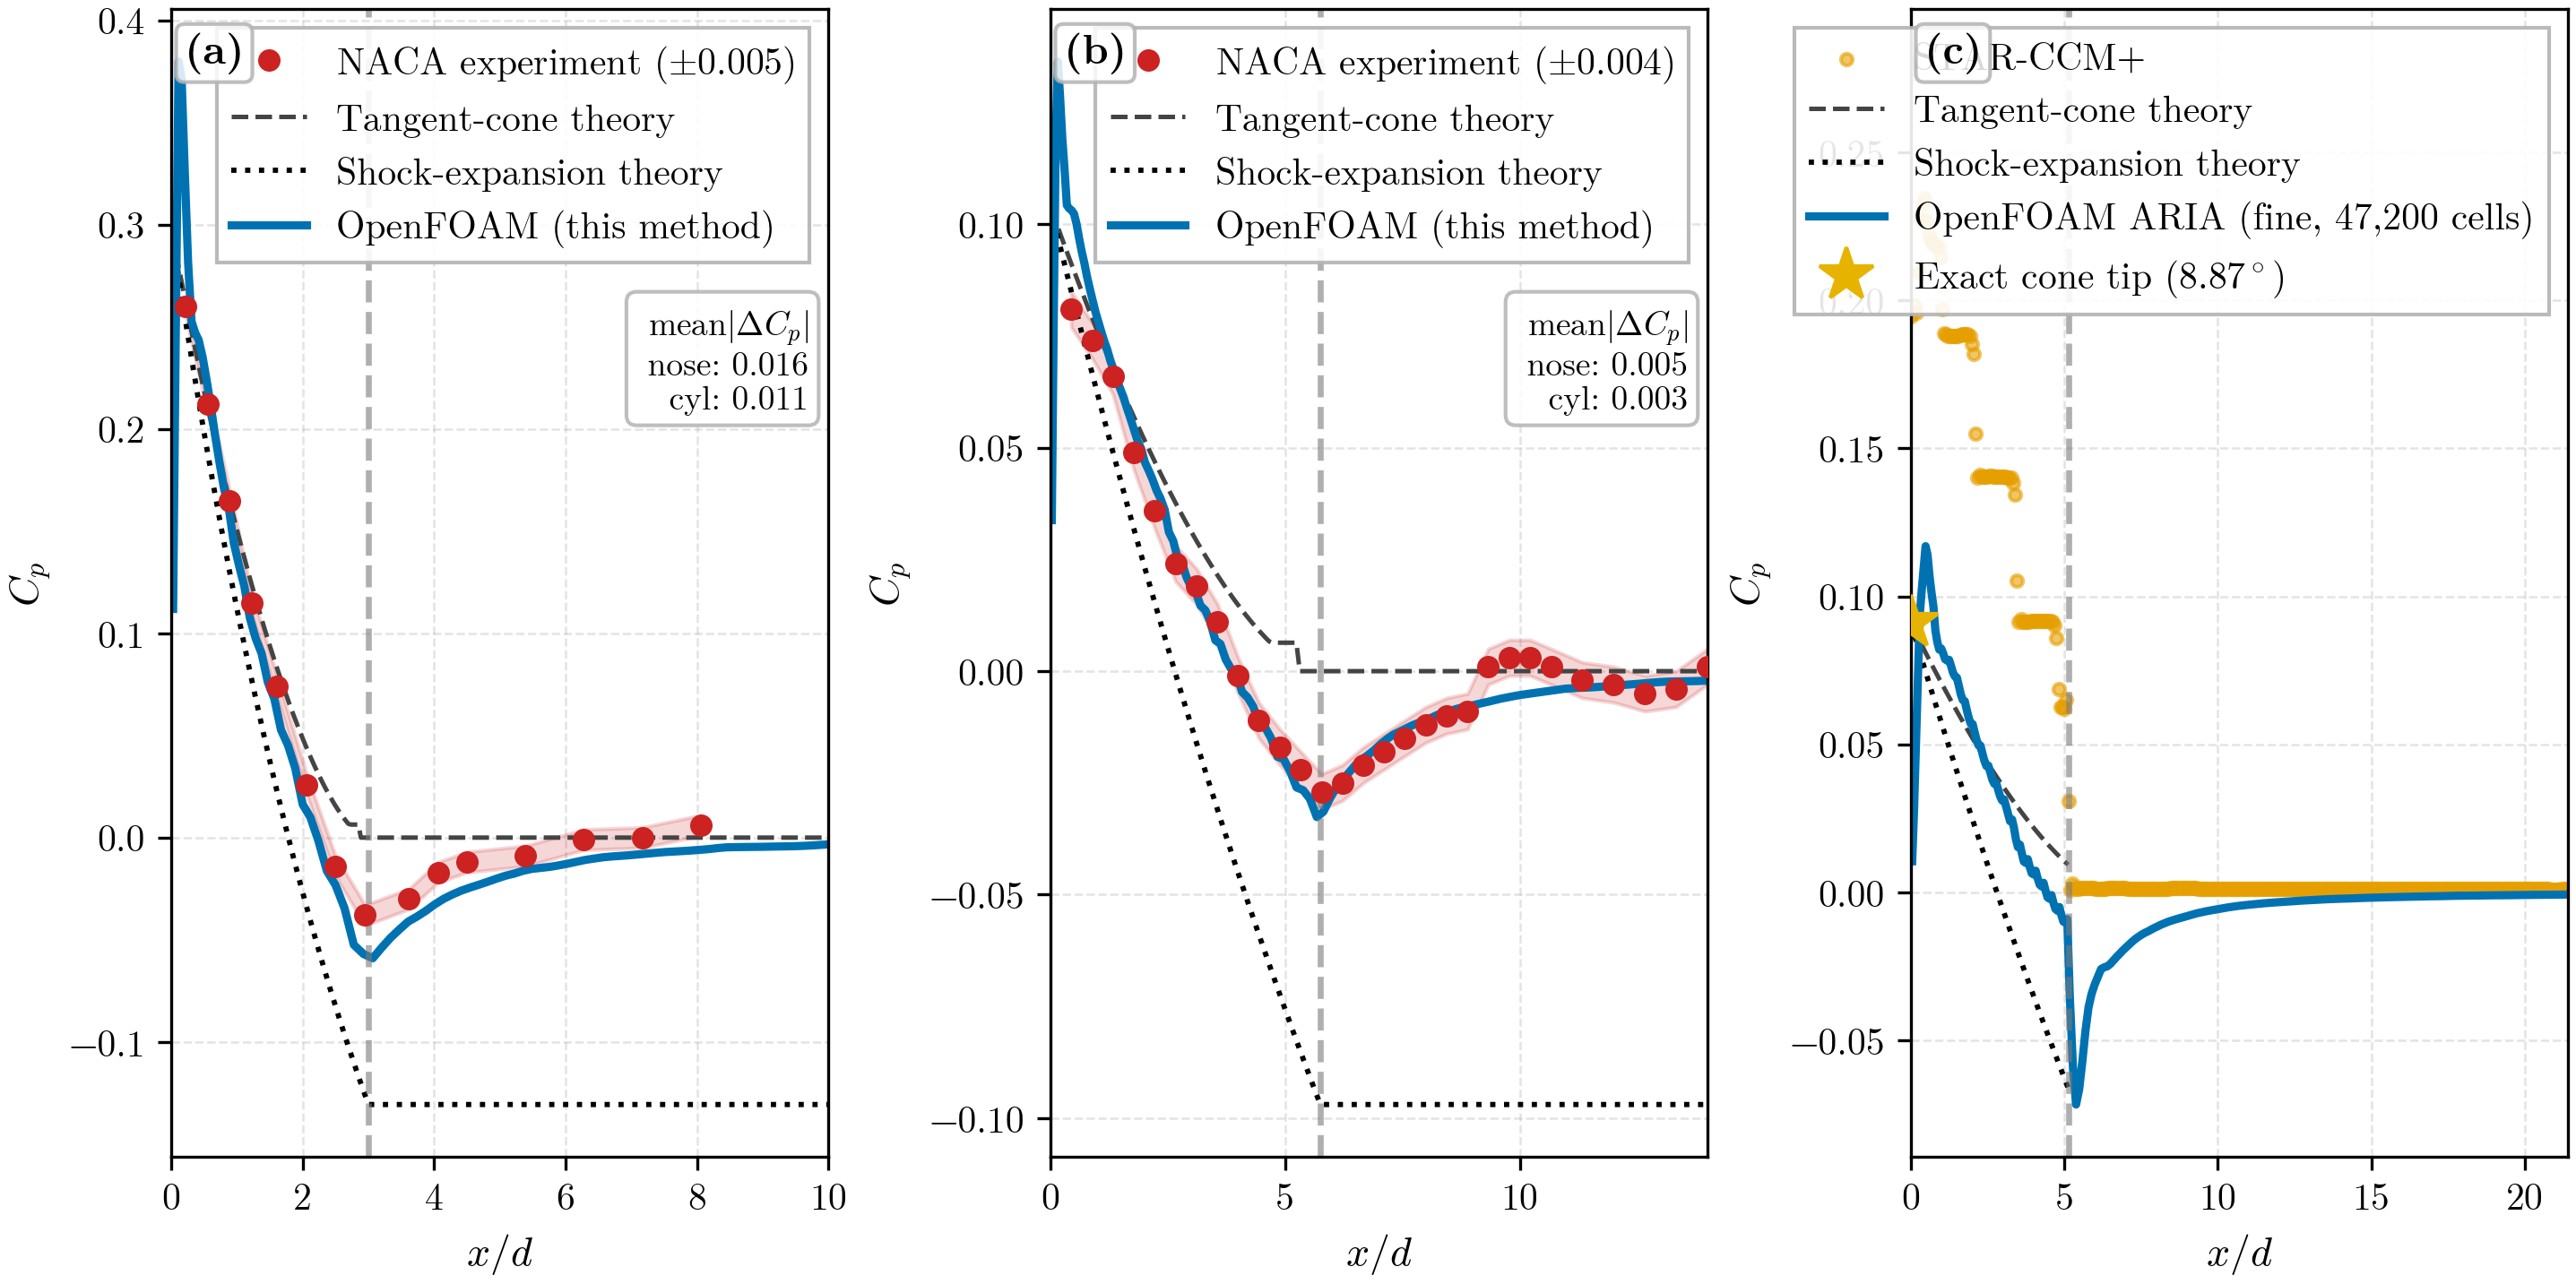
Agreement with another code proves nothing, so I validated against published experiment. Two NACA wind-tunnel datasets at M = 1.98, run with identical numerics. RM A53E01, a fineness-5.75 body and the closest geometry to ARIA: mean |ΔCp| = 0.0040, at or below the quoted ±0.004 tunnel uncertainty. RM A54H23, a fineness-3 body and a harder shock-capture test: mean |ΔCp| = 0.0138.
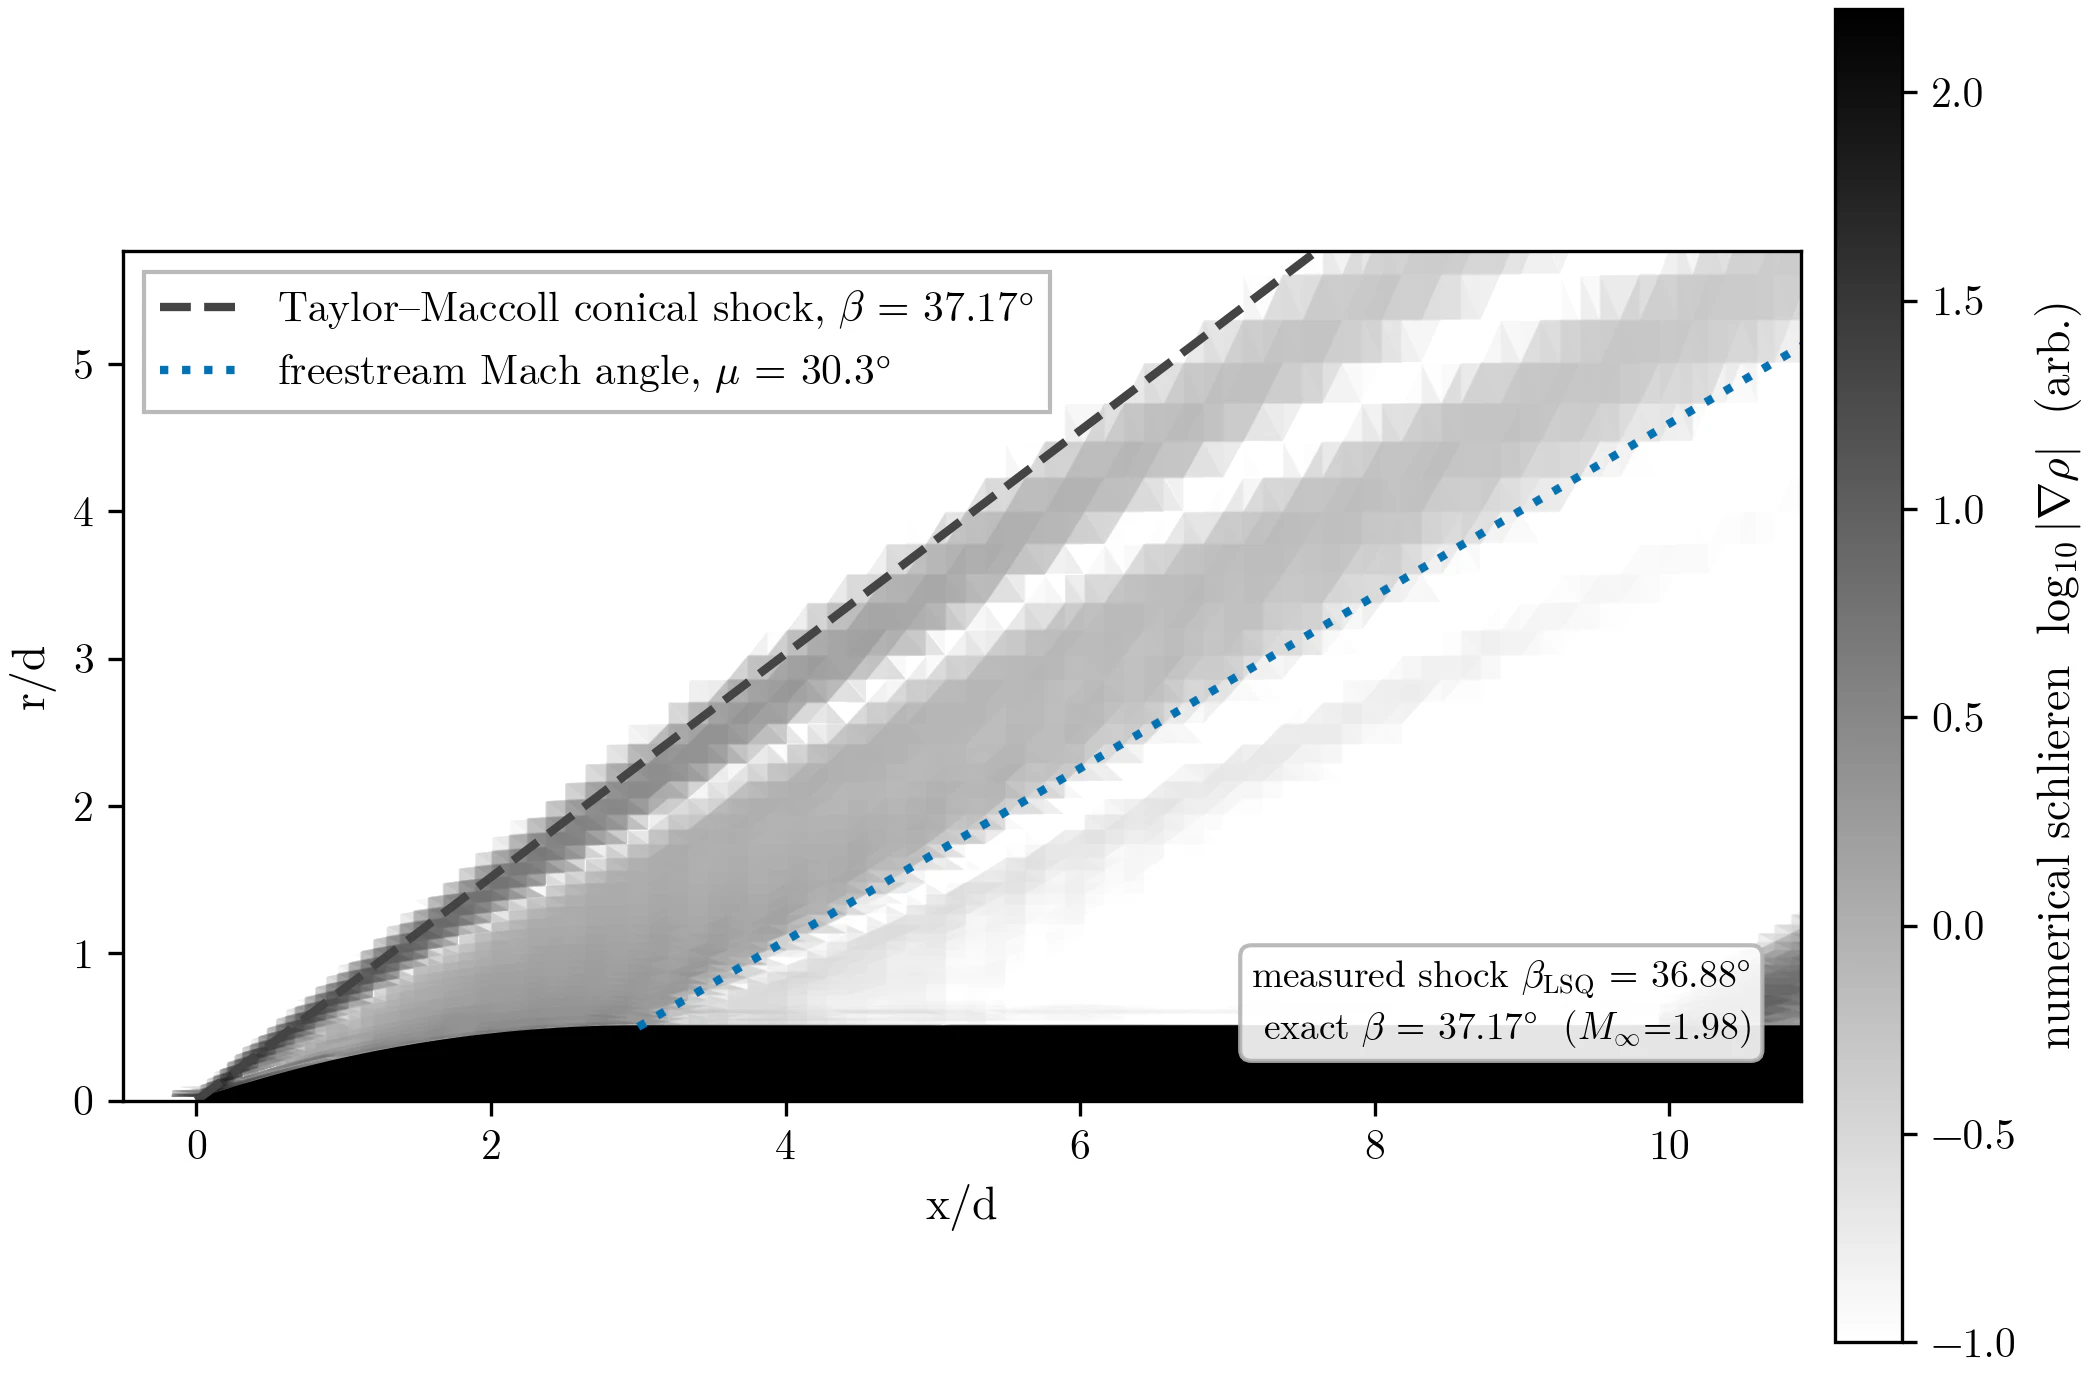
The captured shock angle on the NACA body was 36.88° against an exact 37.17°. In the three-panel summary the CFD sits inside the experimental error band while the legacy STAR-CCM+ benchmark sits far above both experiment and theory.
Grid and scheme
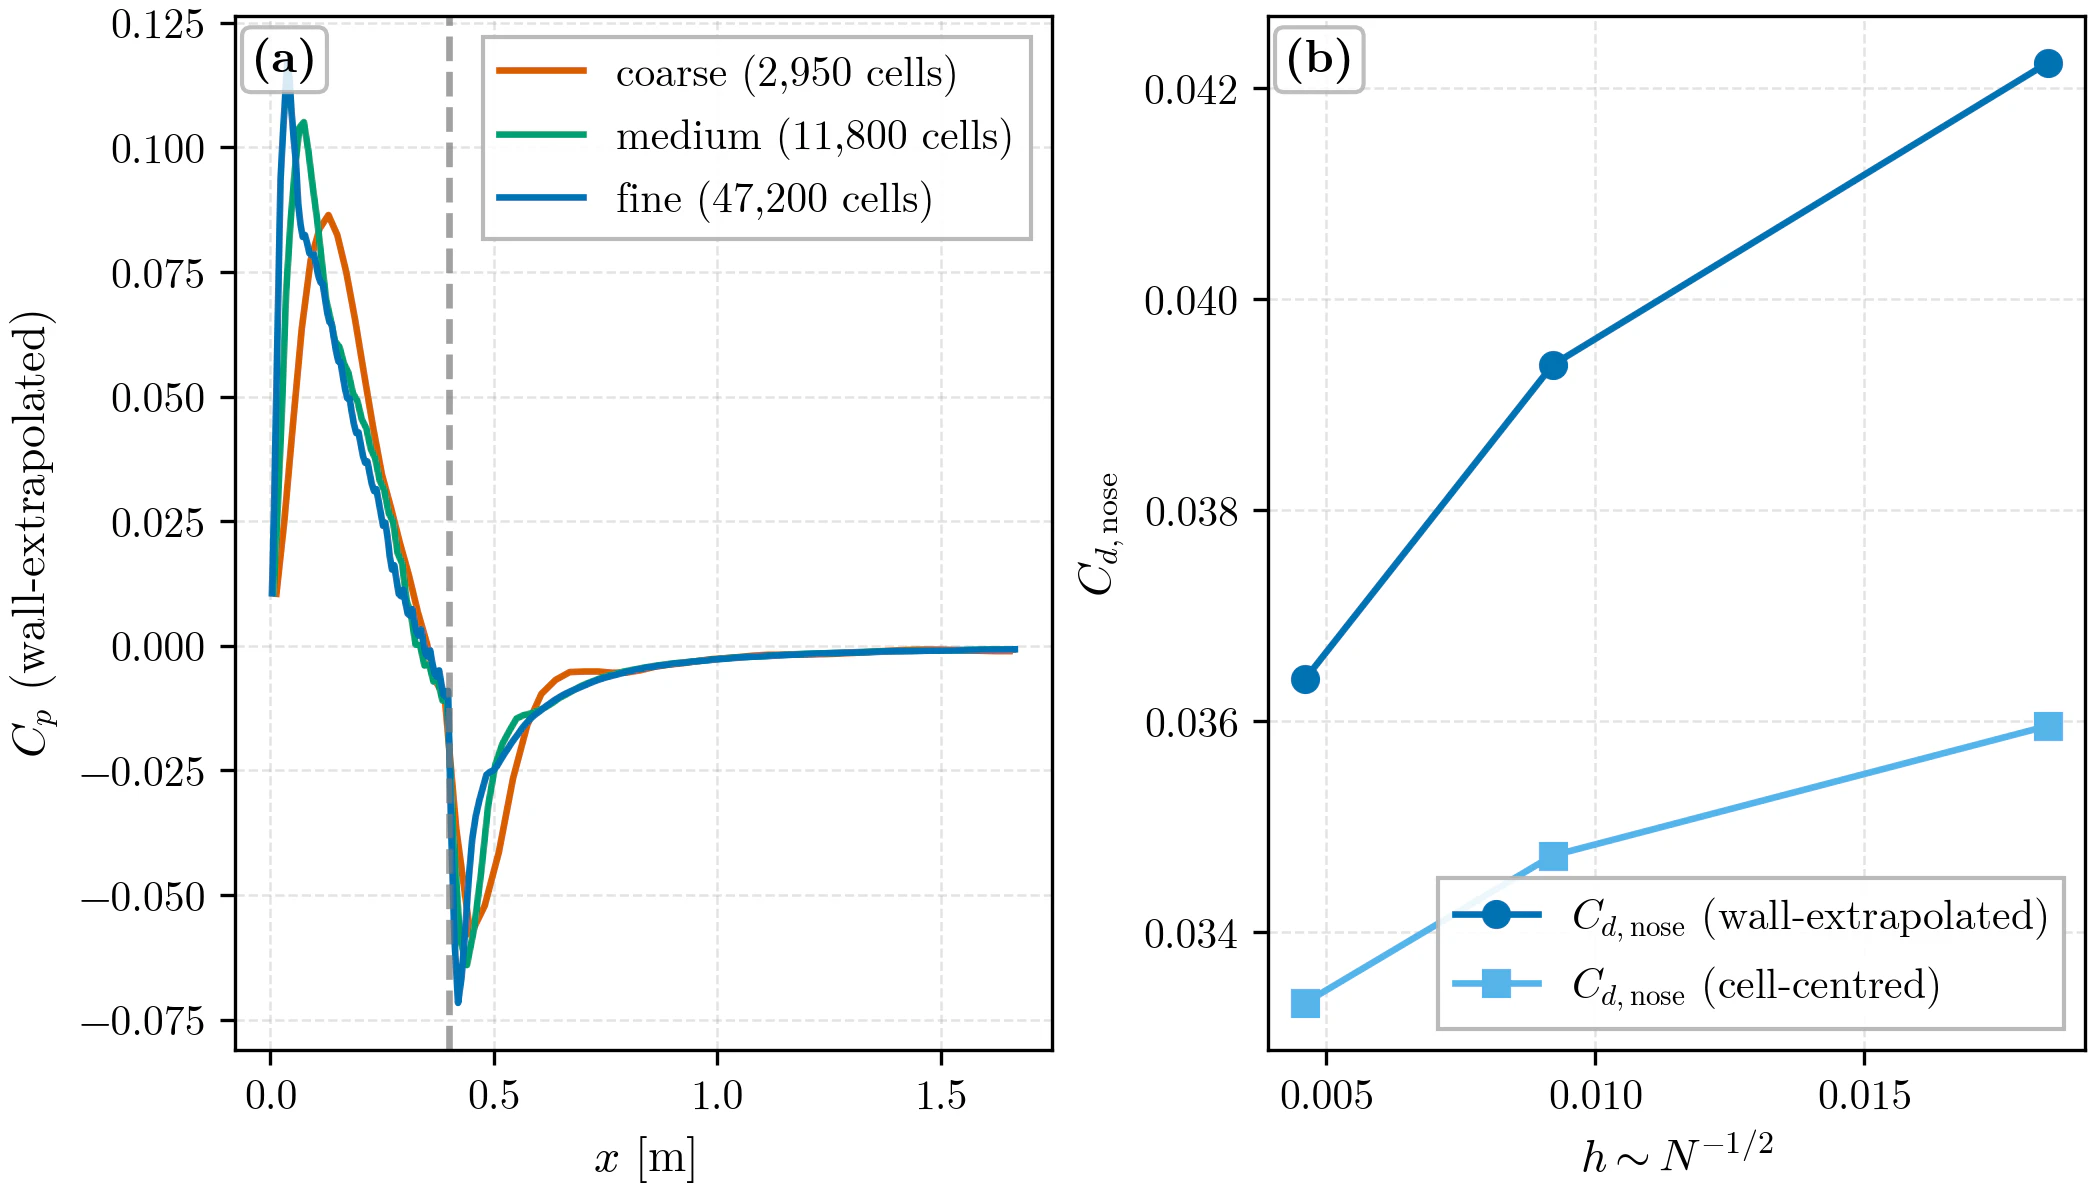
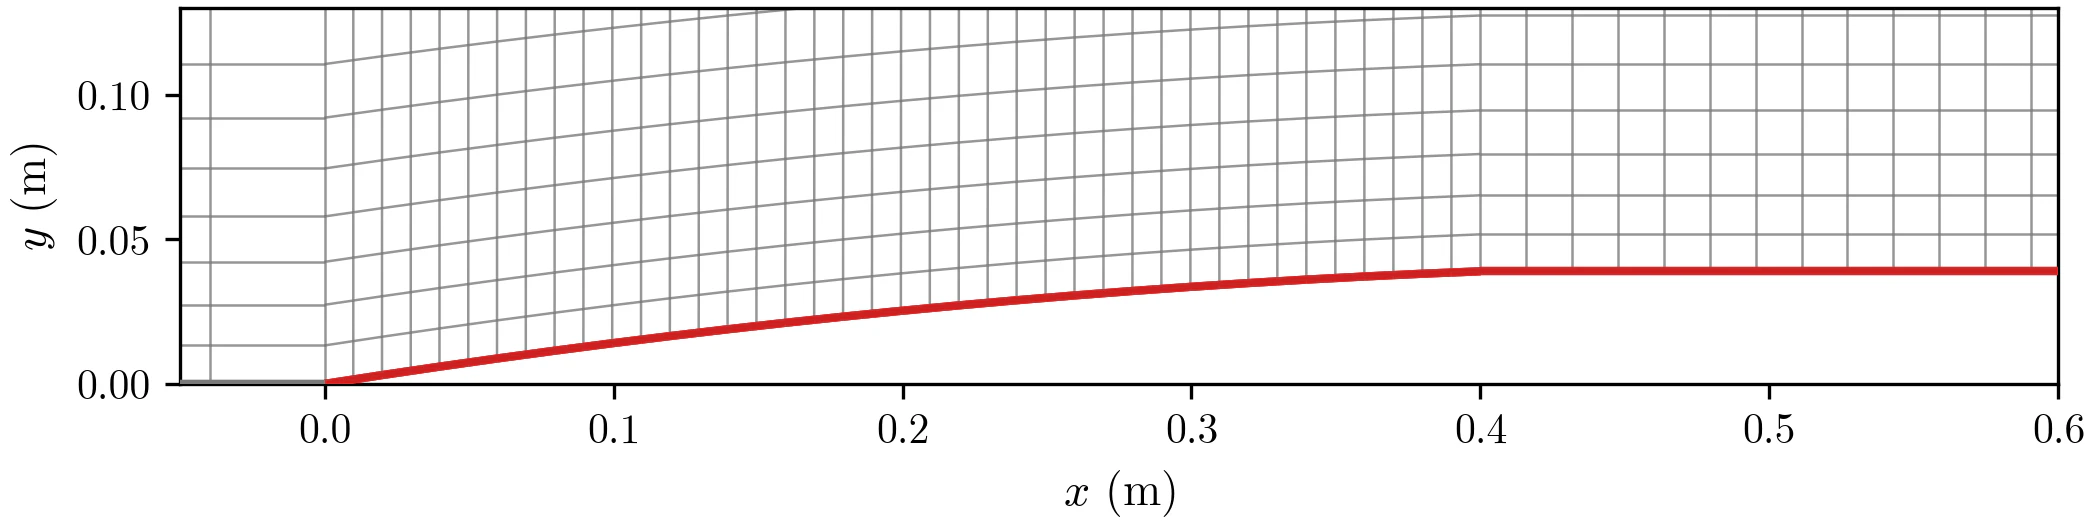
Verification before validation. A refinement-ratio-2 GCI triplet of 2,950, 11,800 and 47,200 cells on a structured axisymmetric mesh bounds the inviscid nose wave drag at C_d,nose = 0.0364 ± 8 %. Doubling the farfield moved mean |ΔCp| by 1.2e-4. Swapping scheme, limiter, flux and energy formulation moved nose drag by ±2 %. Steadiness drift was at most 0.008 %. Framework: the AIAA V&V guide and ASME V&V 20.
Drag
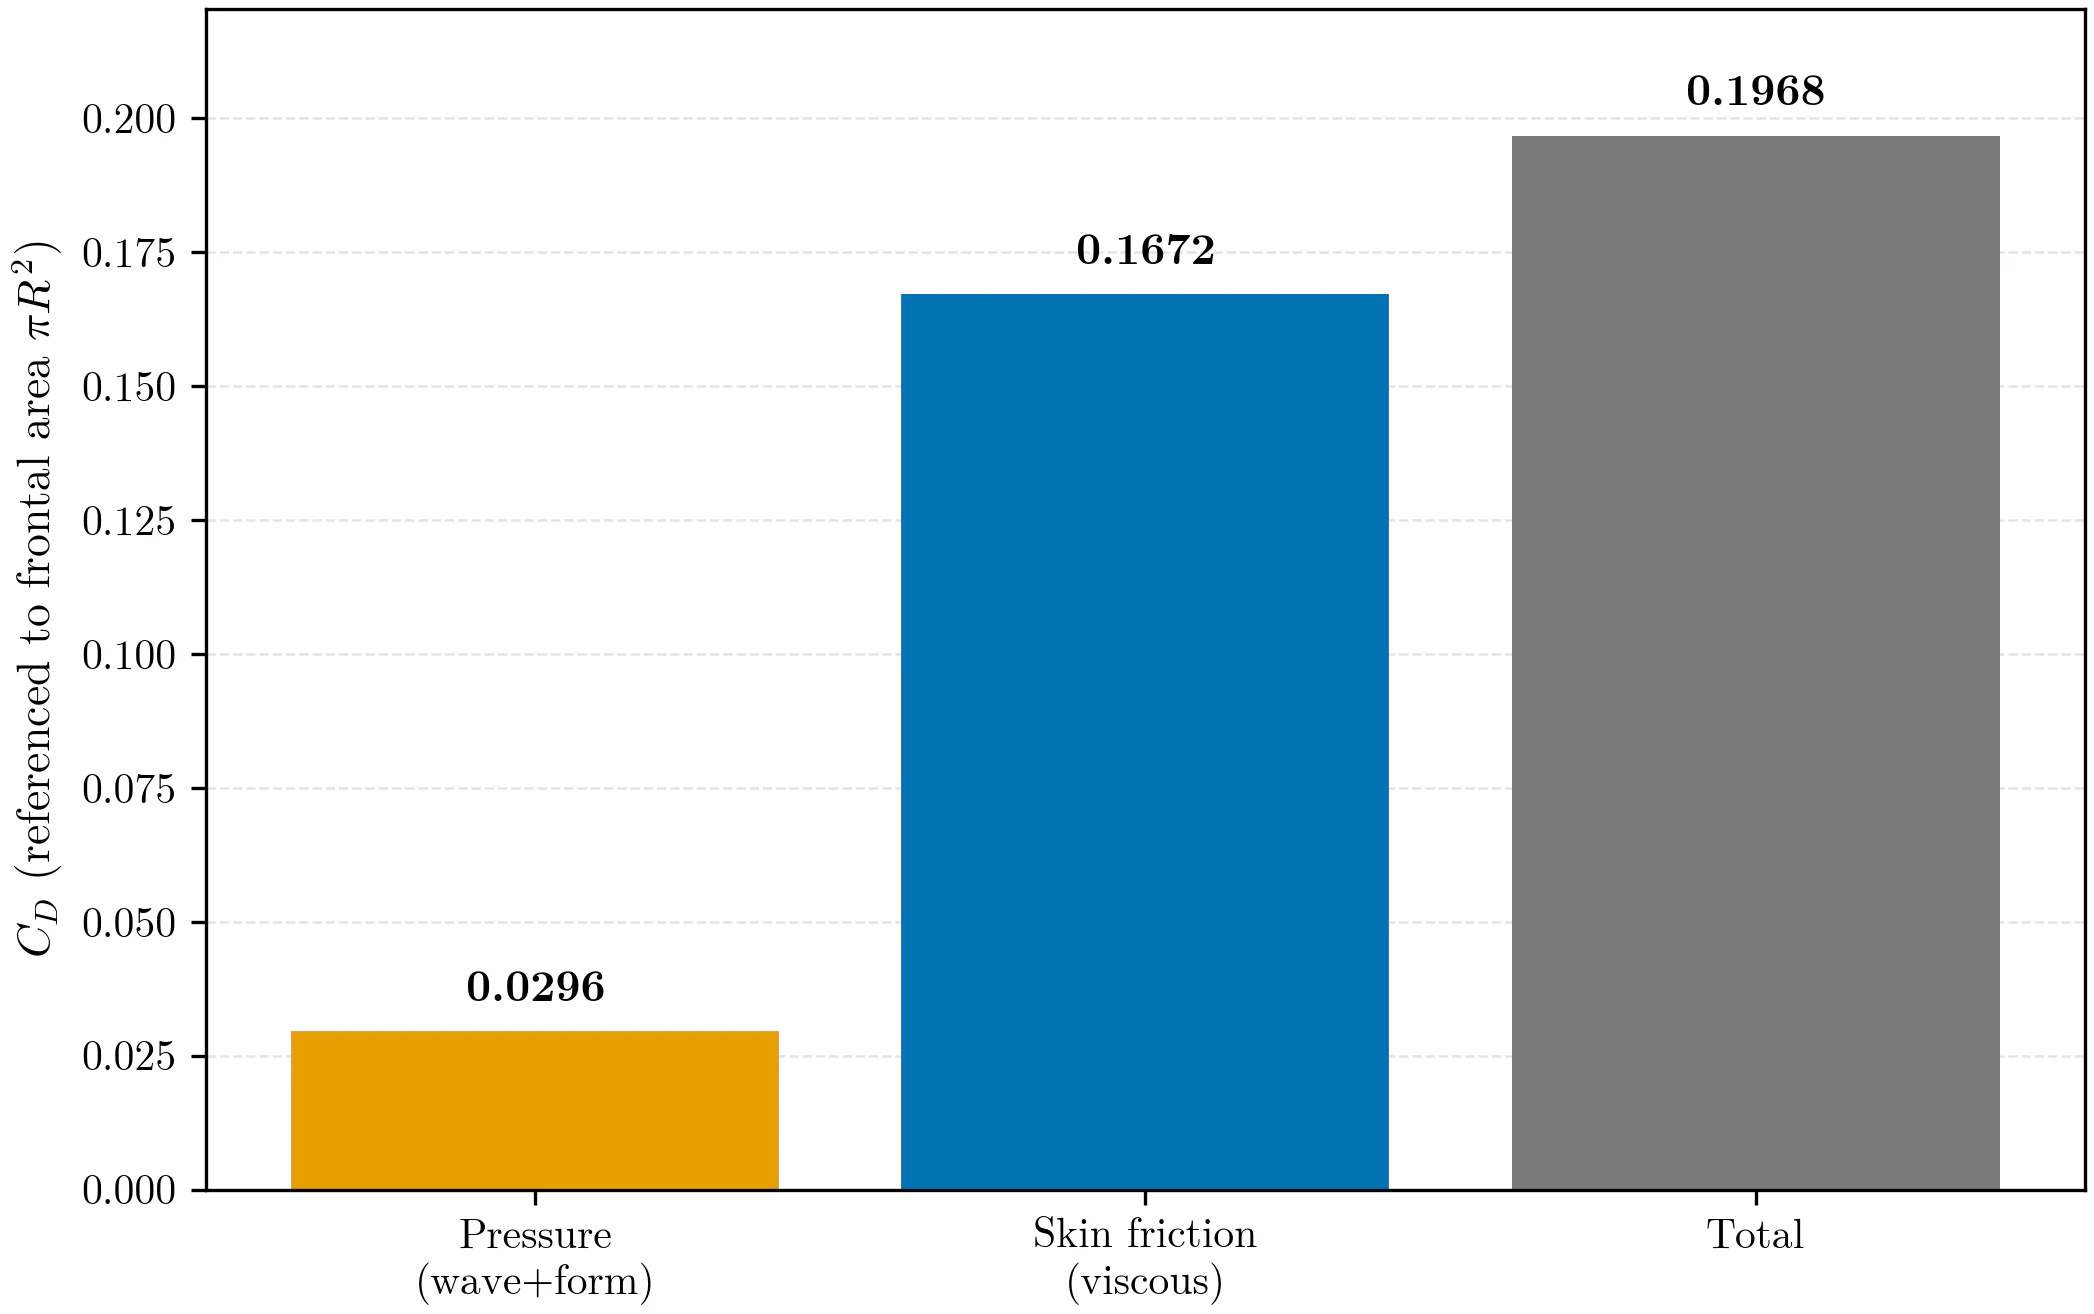
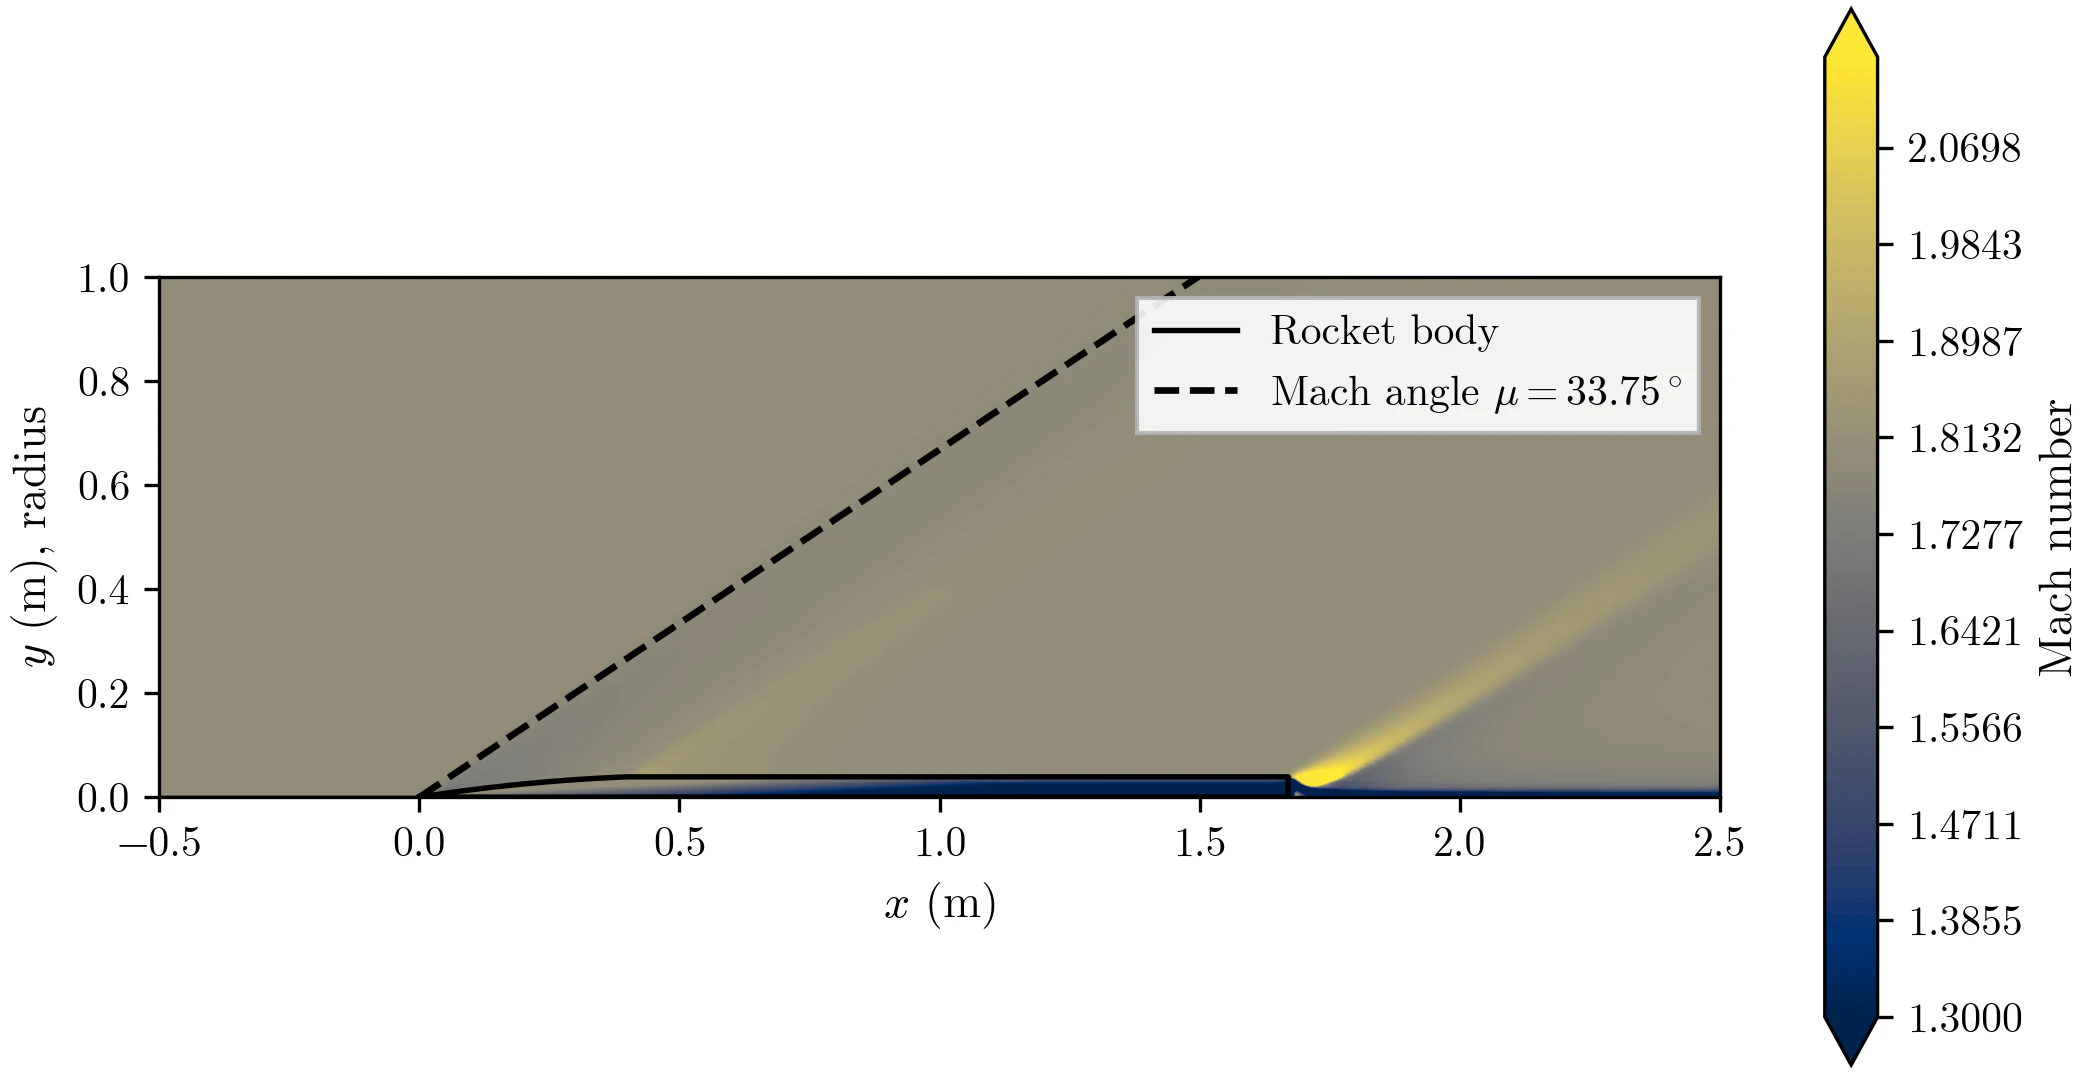
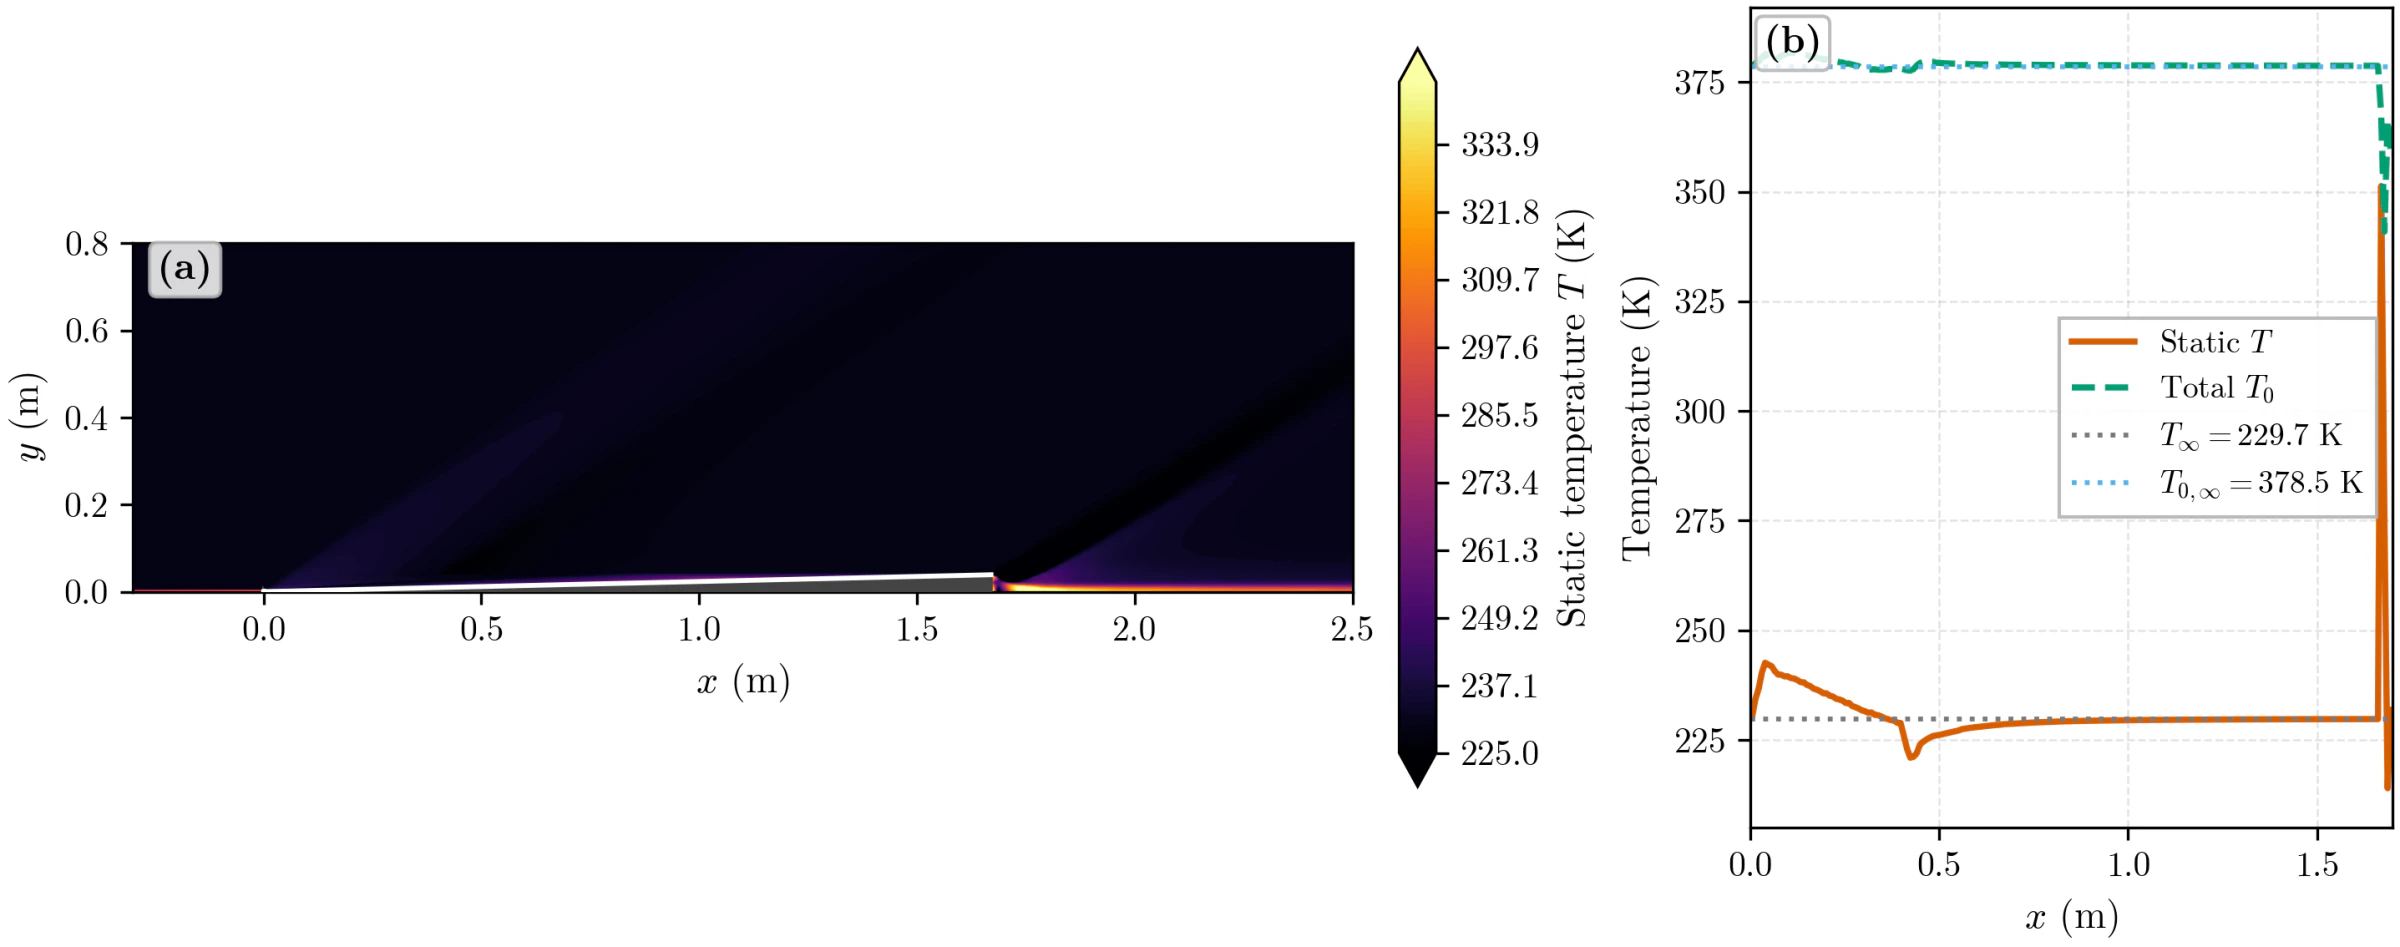
The viscous phase ran k-ω SST at the flight Reynolds number, Re_D ≈ 1.33e6. ARIA total drag came out at C_d = 0.197 referenced to frontal area, of which 85 % is skin friction: pressure 0.030, friction 0.167. That is what a slender L/d ≈ 21 body looks like; the nose wave drag is the small part. Wall temperature recovers toward T₀ = 378.5 K.
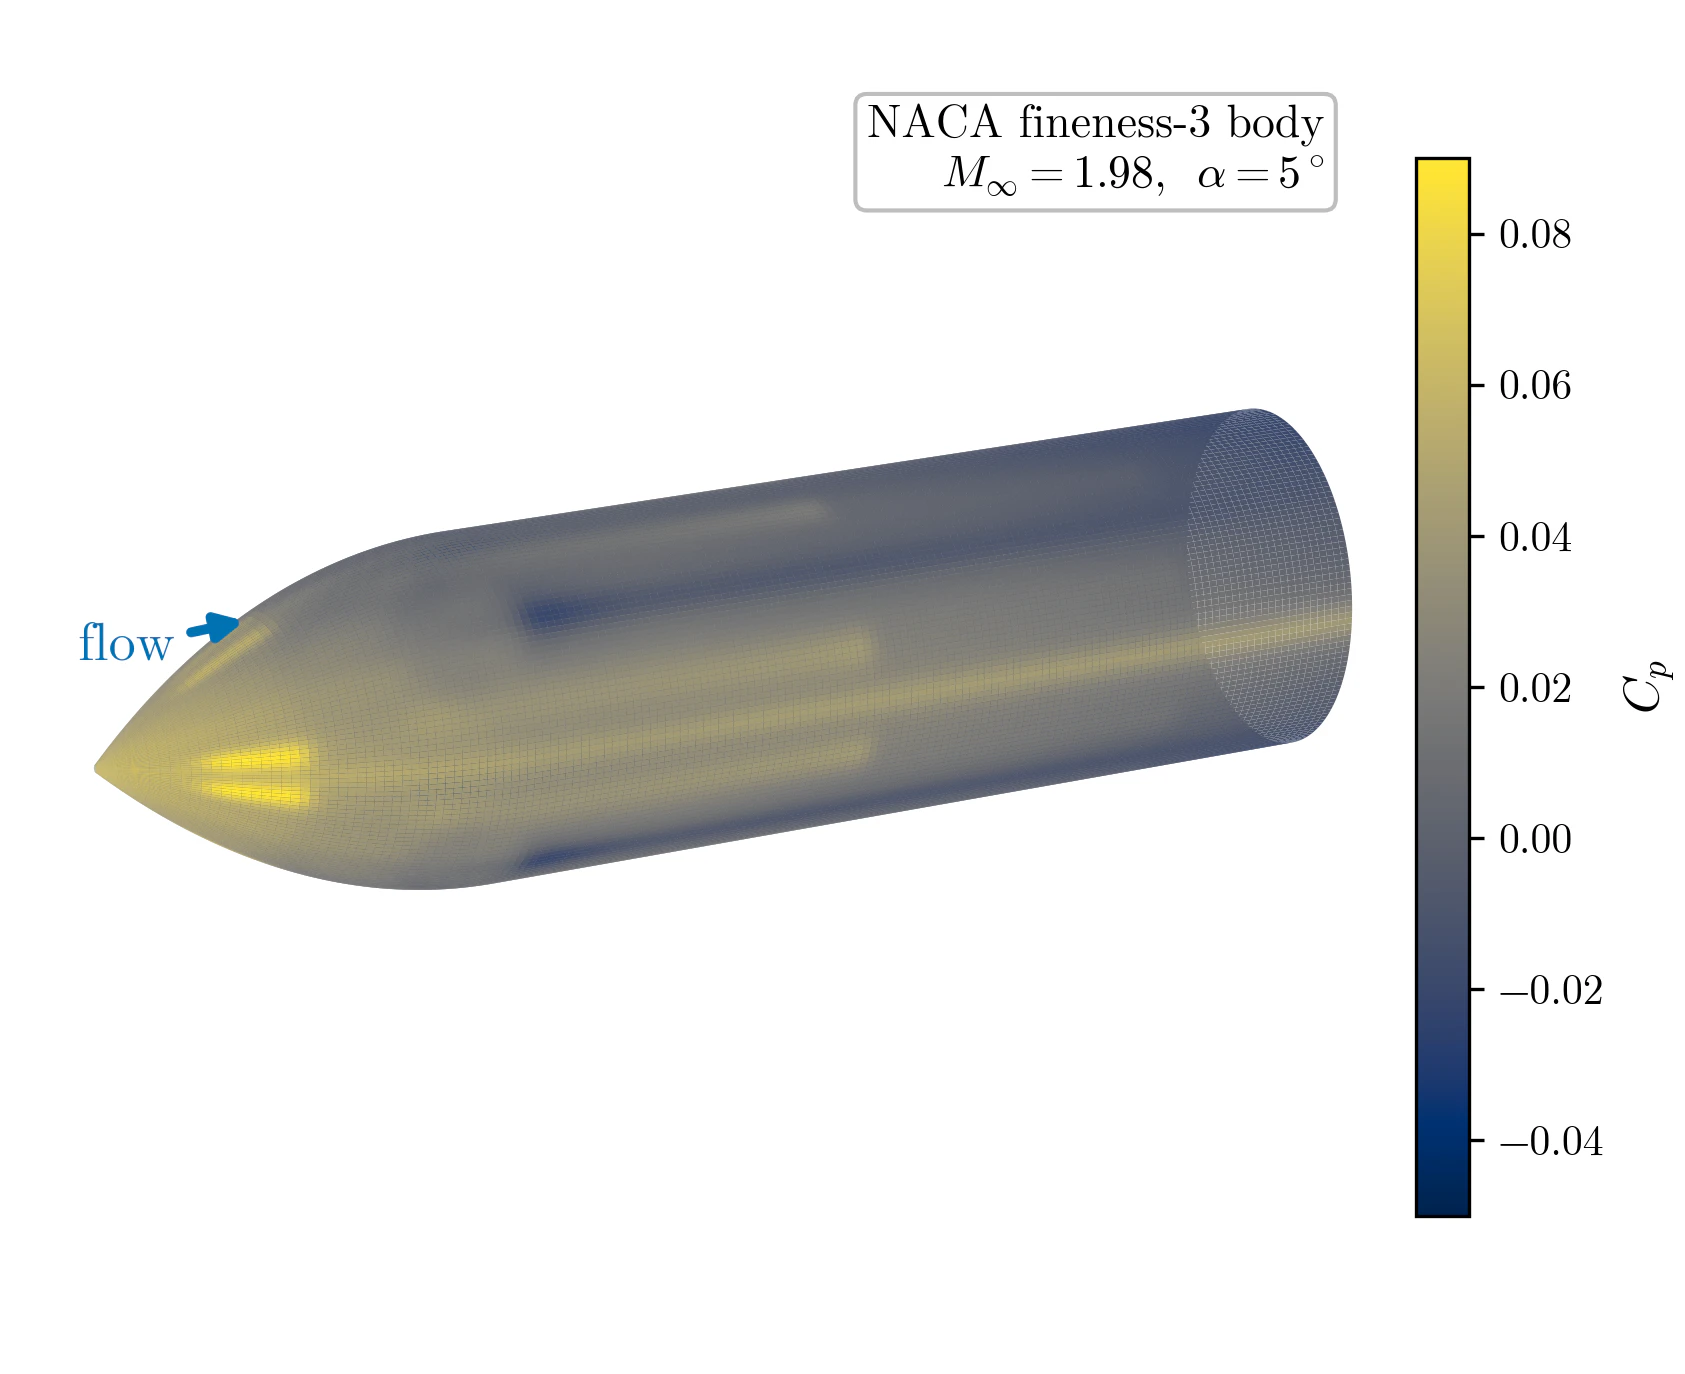
A 3-D case at α = 5° on the NACA body gave a viscous normal force of 0.300 against the experimental 0.272, about 10 %. Three-grid Richardson extrapolation showed the gap is mostly grid and converges to a few percent.
The result, in the round
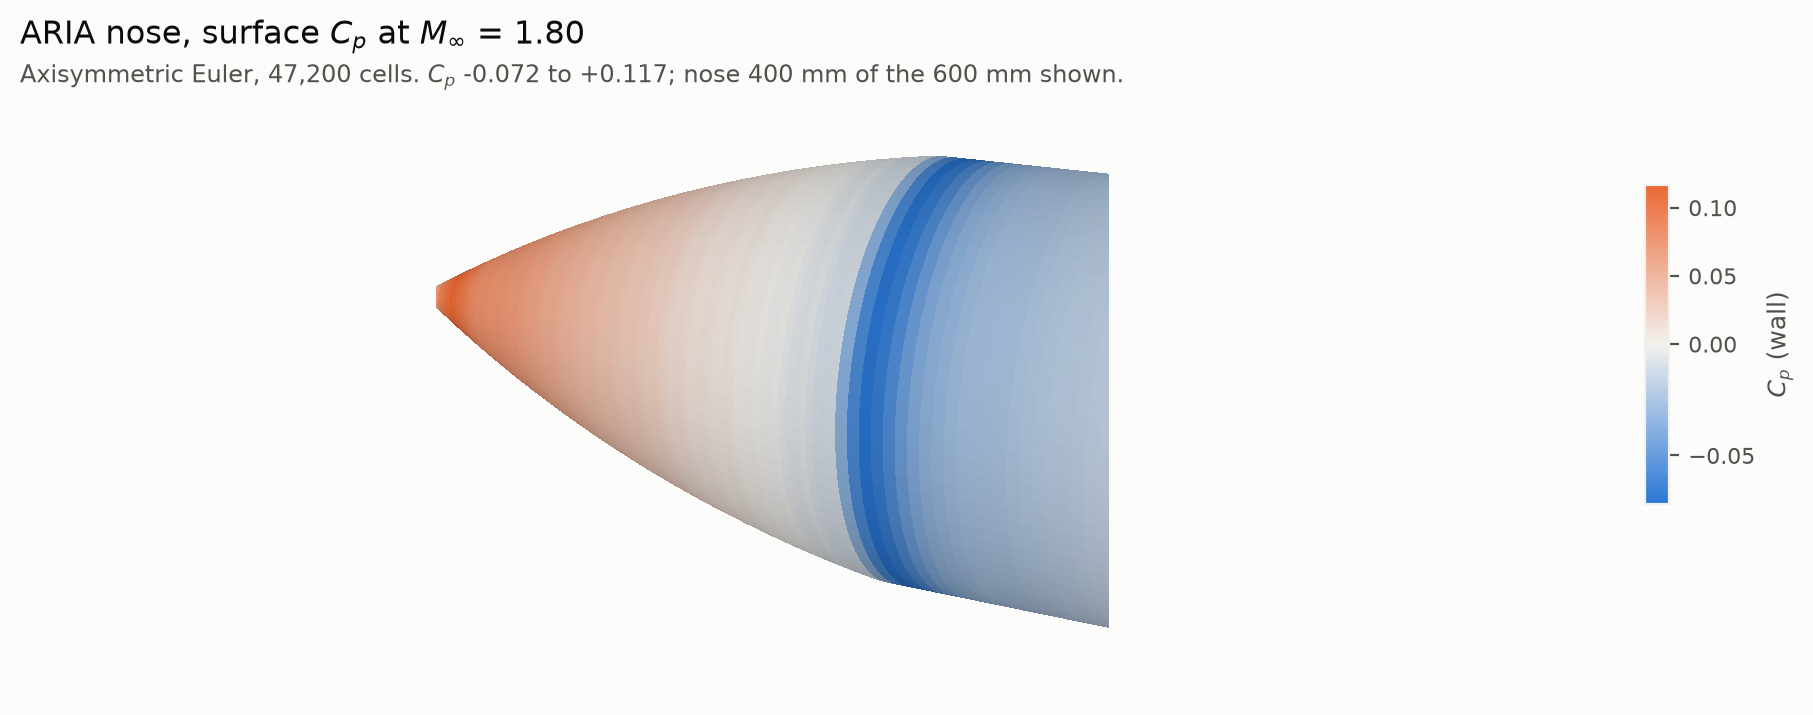
The alpha = 0 solution is axisymmetric, so sweeping the wall pressure round the axis is not an illustration of the result — it is the result. The body below is built from the solver’s own wall-face radii and coloured by the wall-extrapolated Cp, station by station: +0.117 at the tip where the flow is turned, through zero as the nose slims, down to −0.072 in the expansion at the shoulder, then recovering along the afterbody.
Drag it to turn the body, or hover the strip to read x, r and Cp off any station. The nose is 400 mm of the 600 mm shown; the rest of the 1.67 m afterbody sits at a constant 39 mm radius and near-zero Cp.
Faster
OpenFOAM's localEuler local time-stepping converges the same steady case 12.7× faster than global time-stepping. I treated it as one more thing to verify rather than a free lunch: the Cp distributions and nose drag from the LTS run match the global-step run, so the acceleration is accuracy-neutral.
Paper
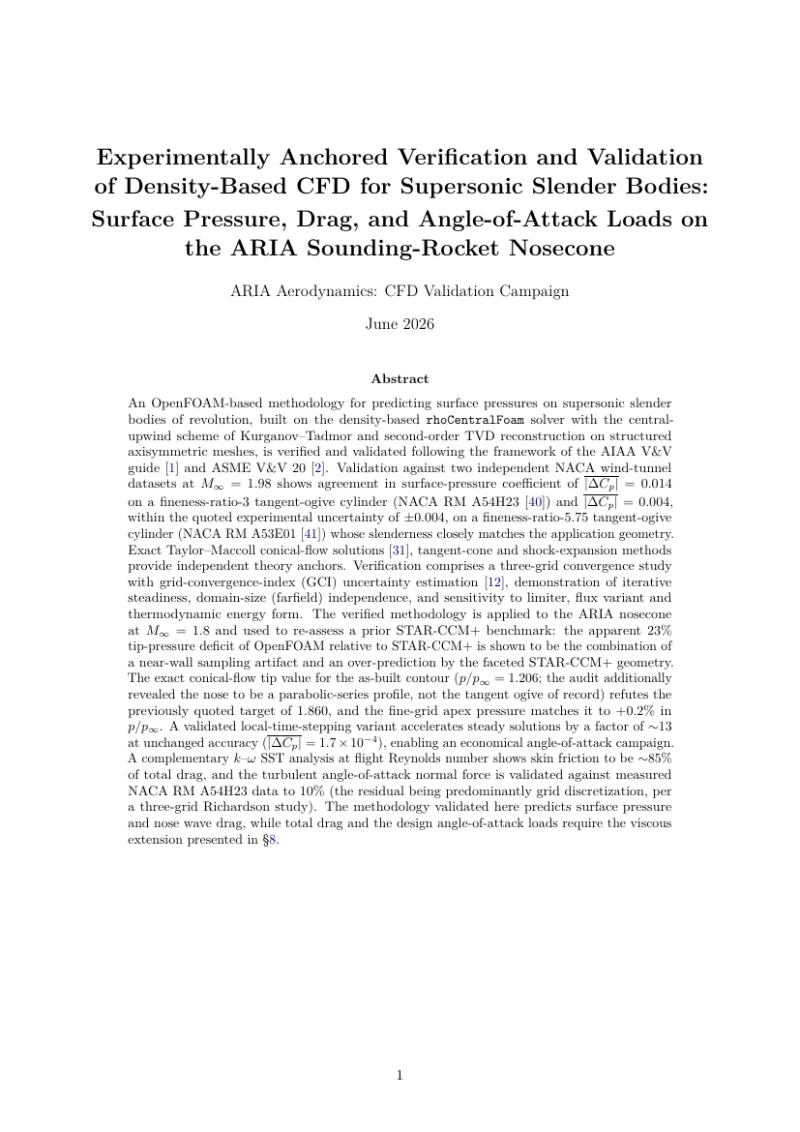
The full write-up is a research-paper-style V&V report, Experimentally Anchored Verification and Validation of Density-Based CFD for Supersonic Slender Bodies, v6, June 2026. It follows the AIAA V&V guide and ASME V&V 20 and records every number above with its uncertainty. The repo is public under MIT with the cases, data and figure scripts archived.