Ethan Sheehan
All work — 2025

Bristol Composites Institute

Curvature-to-stress prediction for 3D-printed flax/PLA hygromorph strips: 72 specimens, 10 batches, a test-set leak found and killed, and a paper on why the shape transfers and the scale does not.
RoleResearch intern
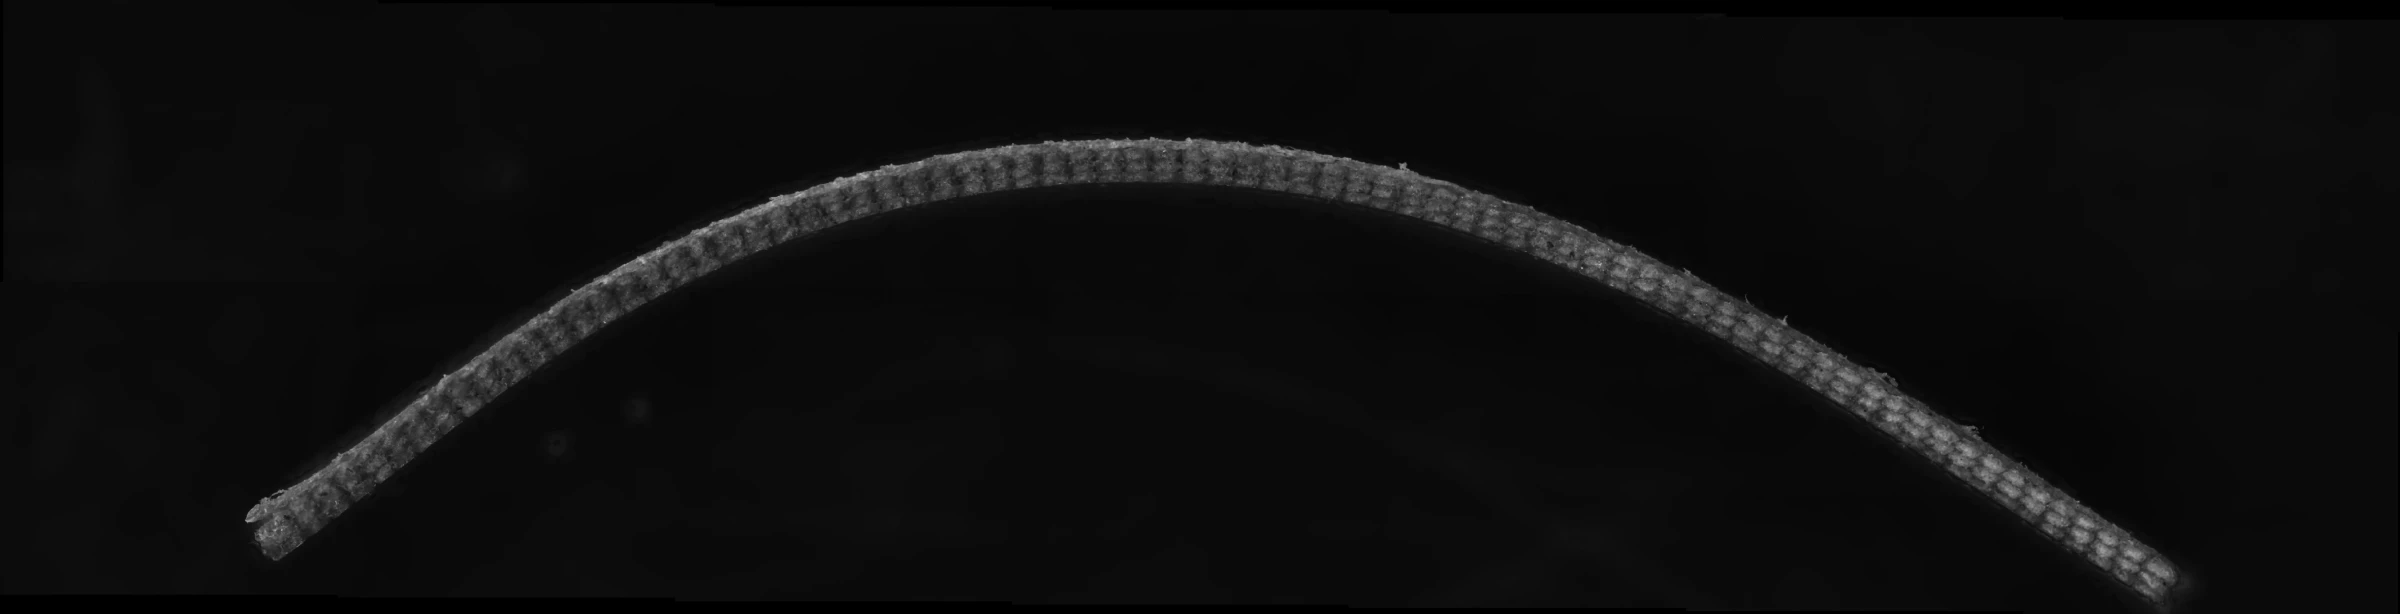
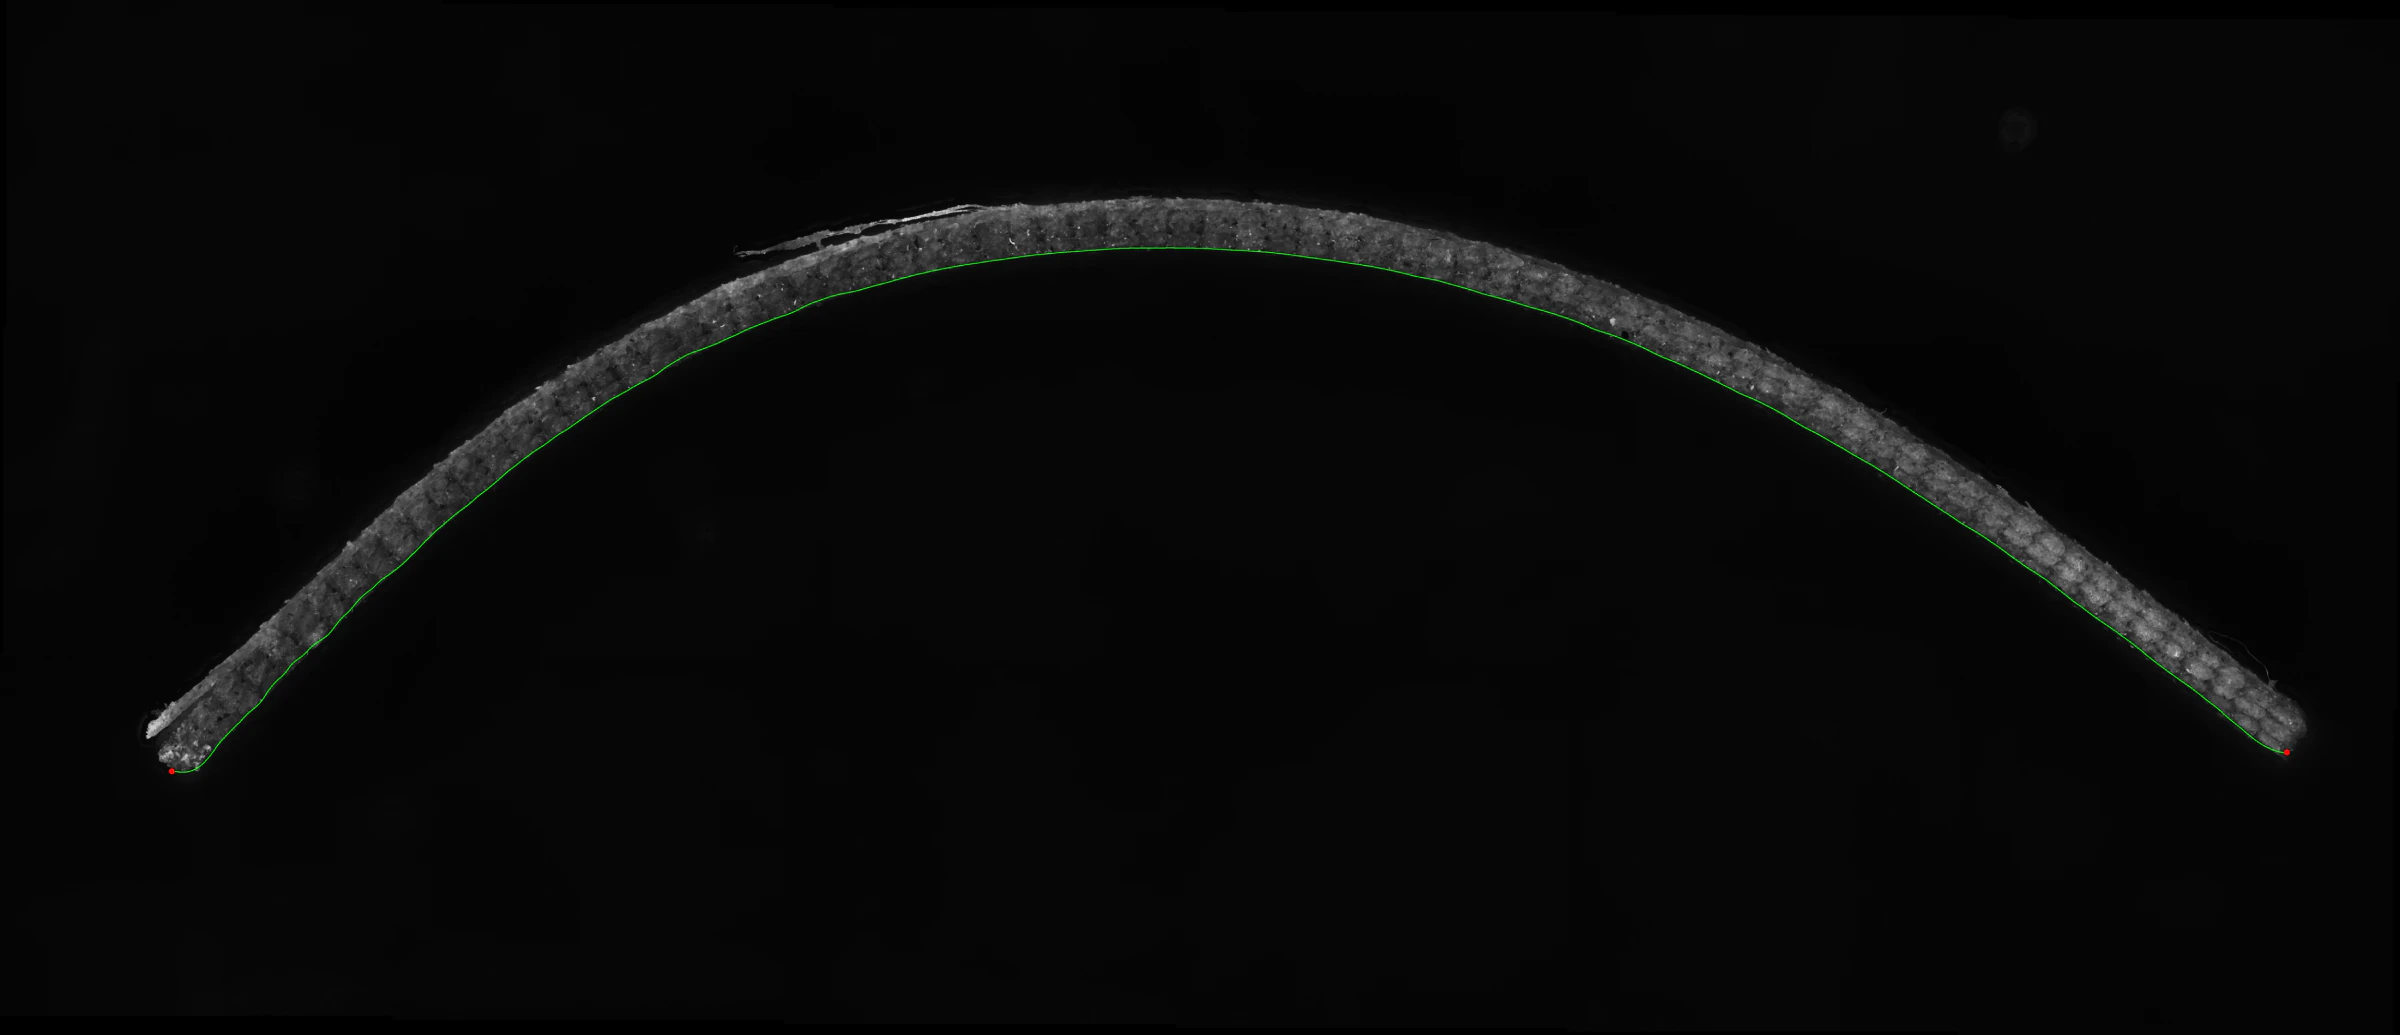
Stitched microscope tile scan of a curved flax/PLA hygromorph strip, a pale woven arc against black
Master-curve R²
0.92
Specimens
72 / 10 batches
Self-calibration R²
0.74
01

Hygromorphs

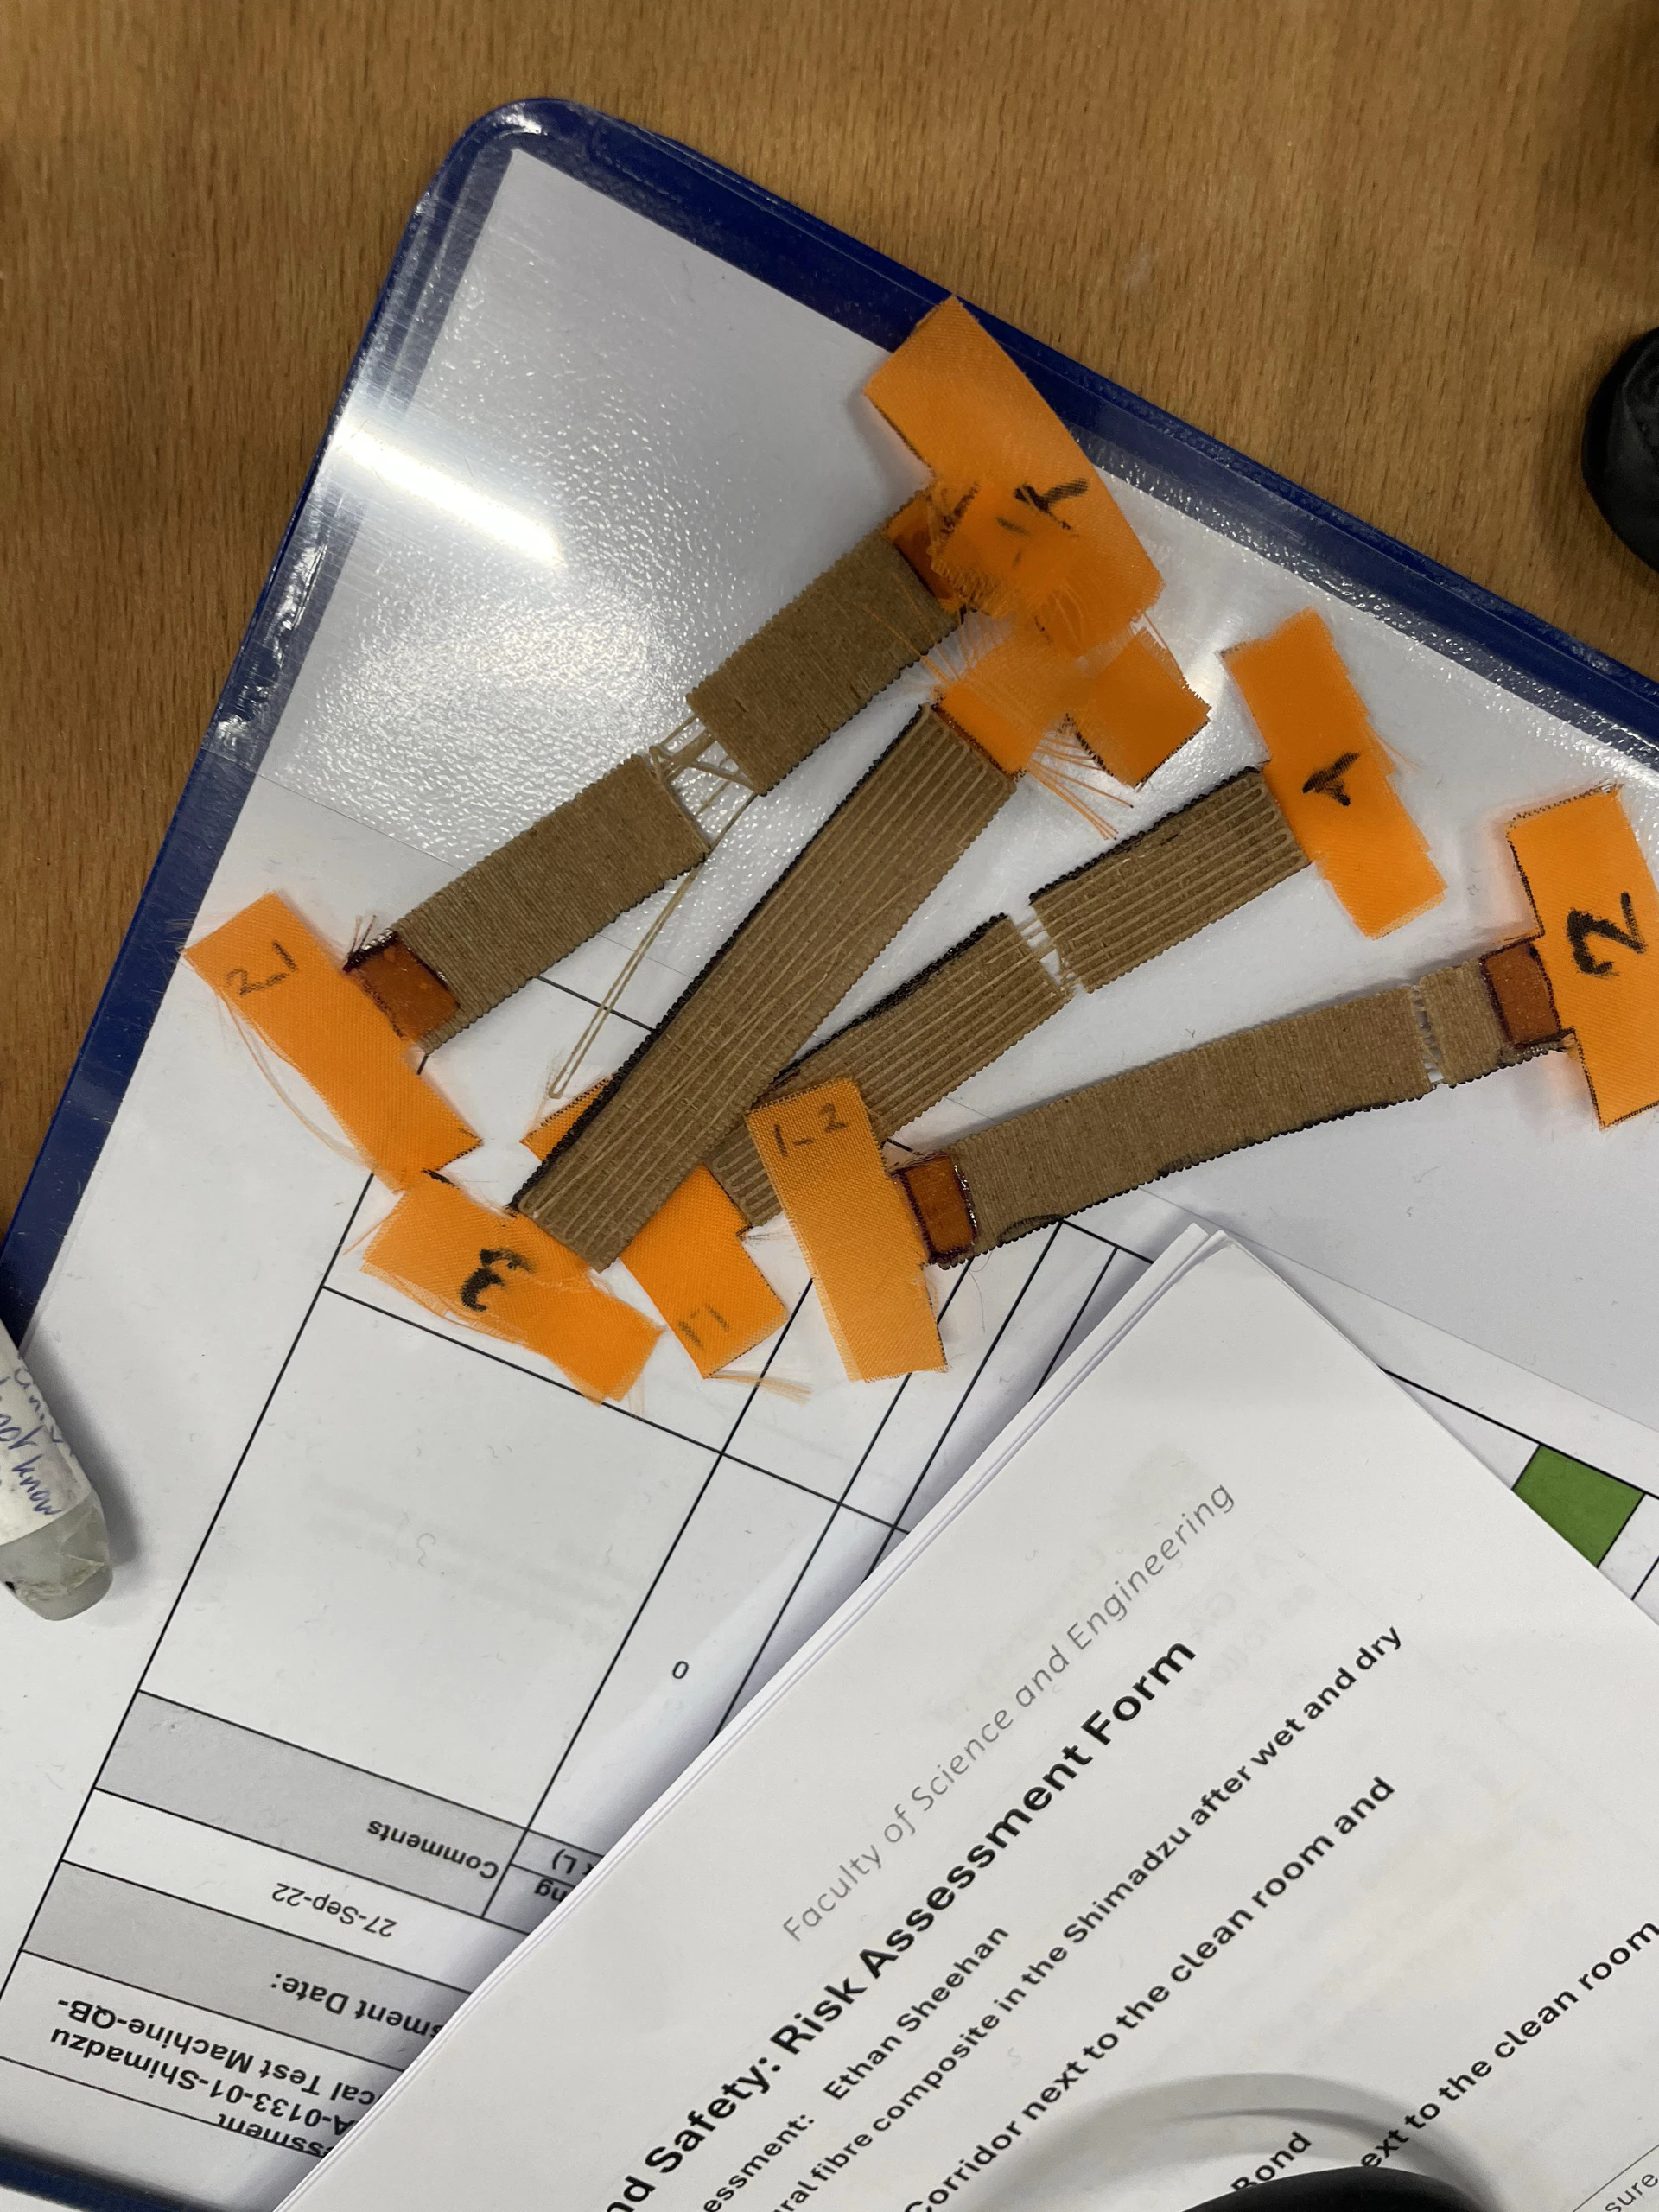
Continuous flax fibre in a PLA matrix, 3D printed as thin strips. Flax swells with moisture, so the strips bend as the humidity changes: a passive actuator, and a route to structures that morph without motors. The question I was given was the inverse one. Given the shape a strip has taken, what surface stress is it carrying? Over the summer I humidity-conditioned, bagged and labelled 72 specimens, which turned out later to come from 10 manufacturing batches, wrote the risk assessment for the tensile work, and built the dataset both models below were trained on.
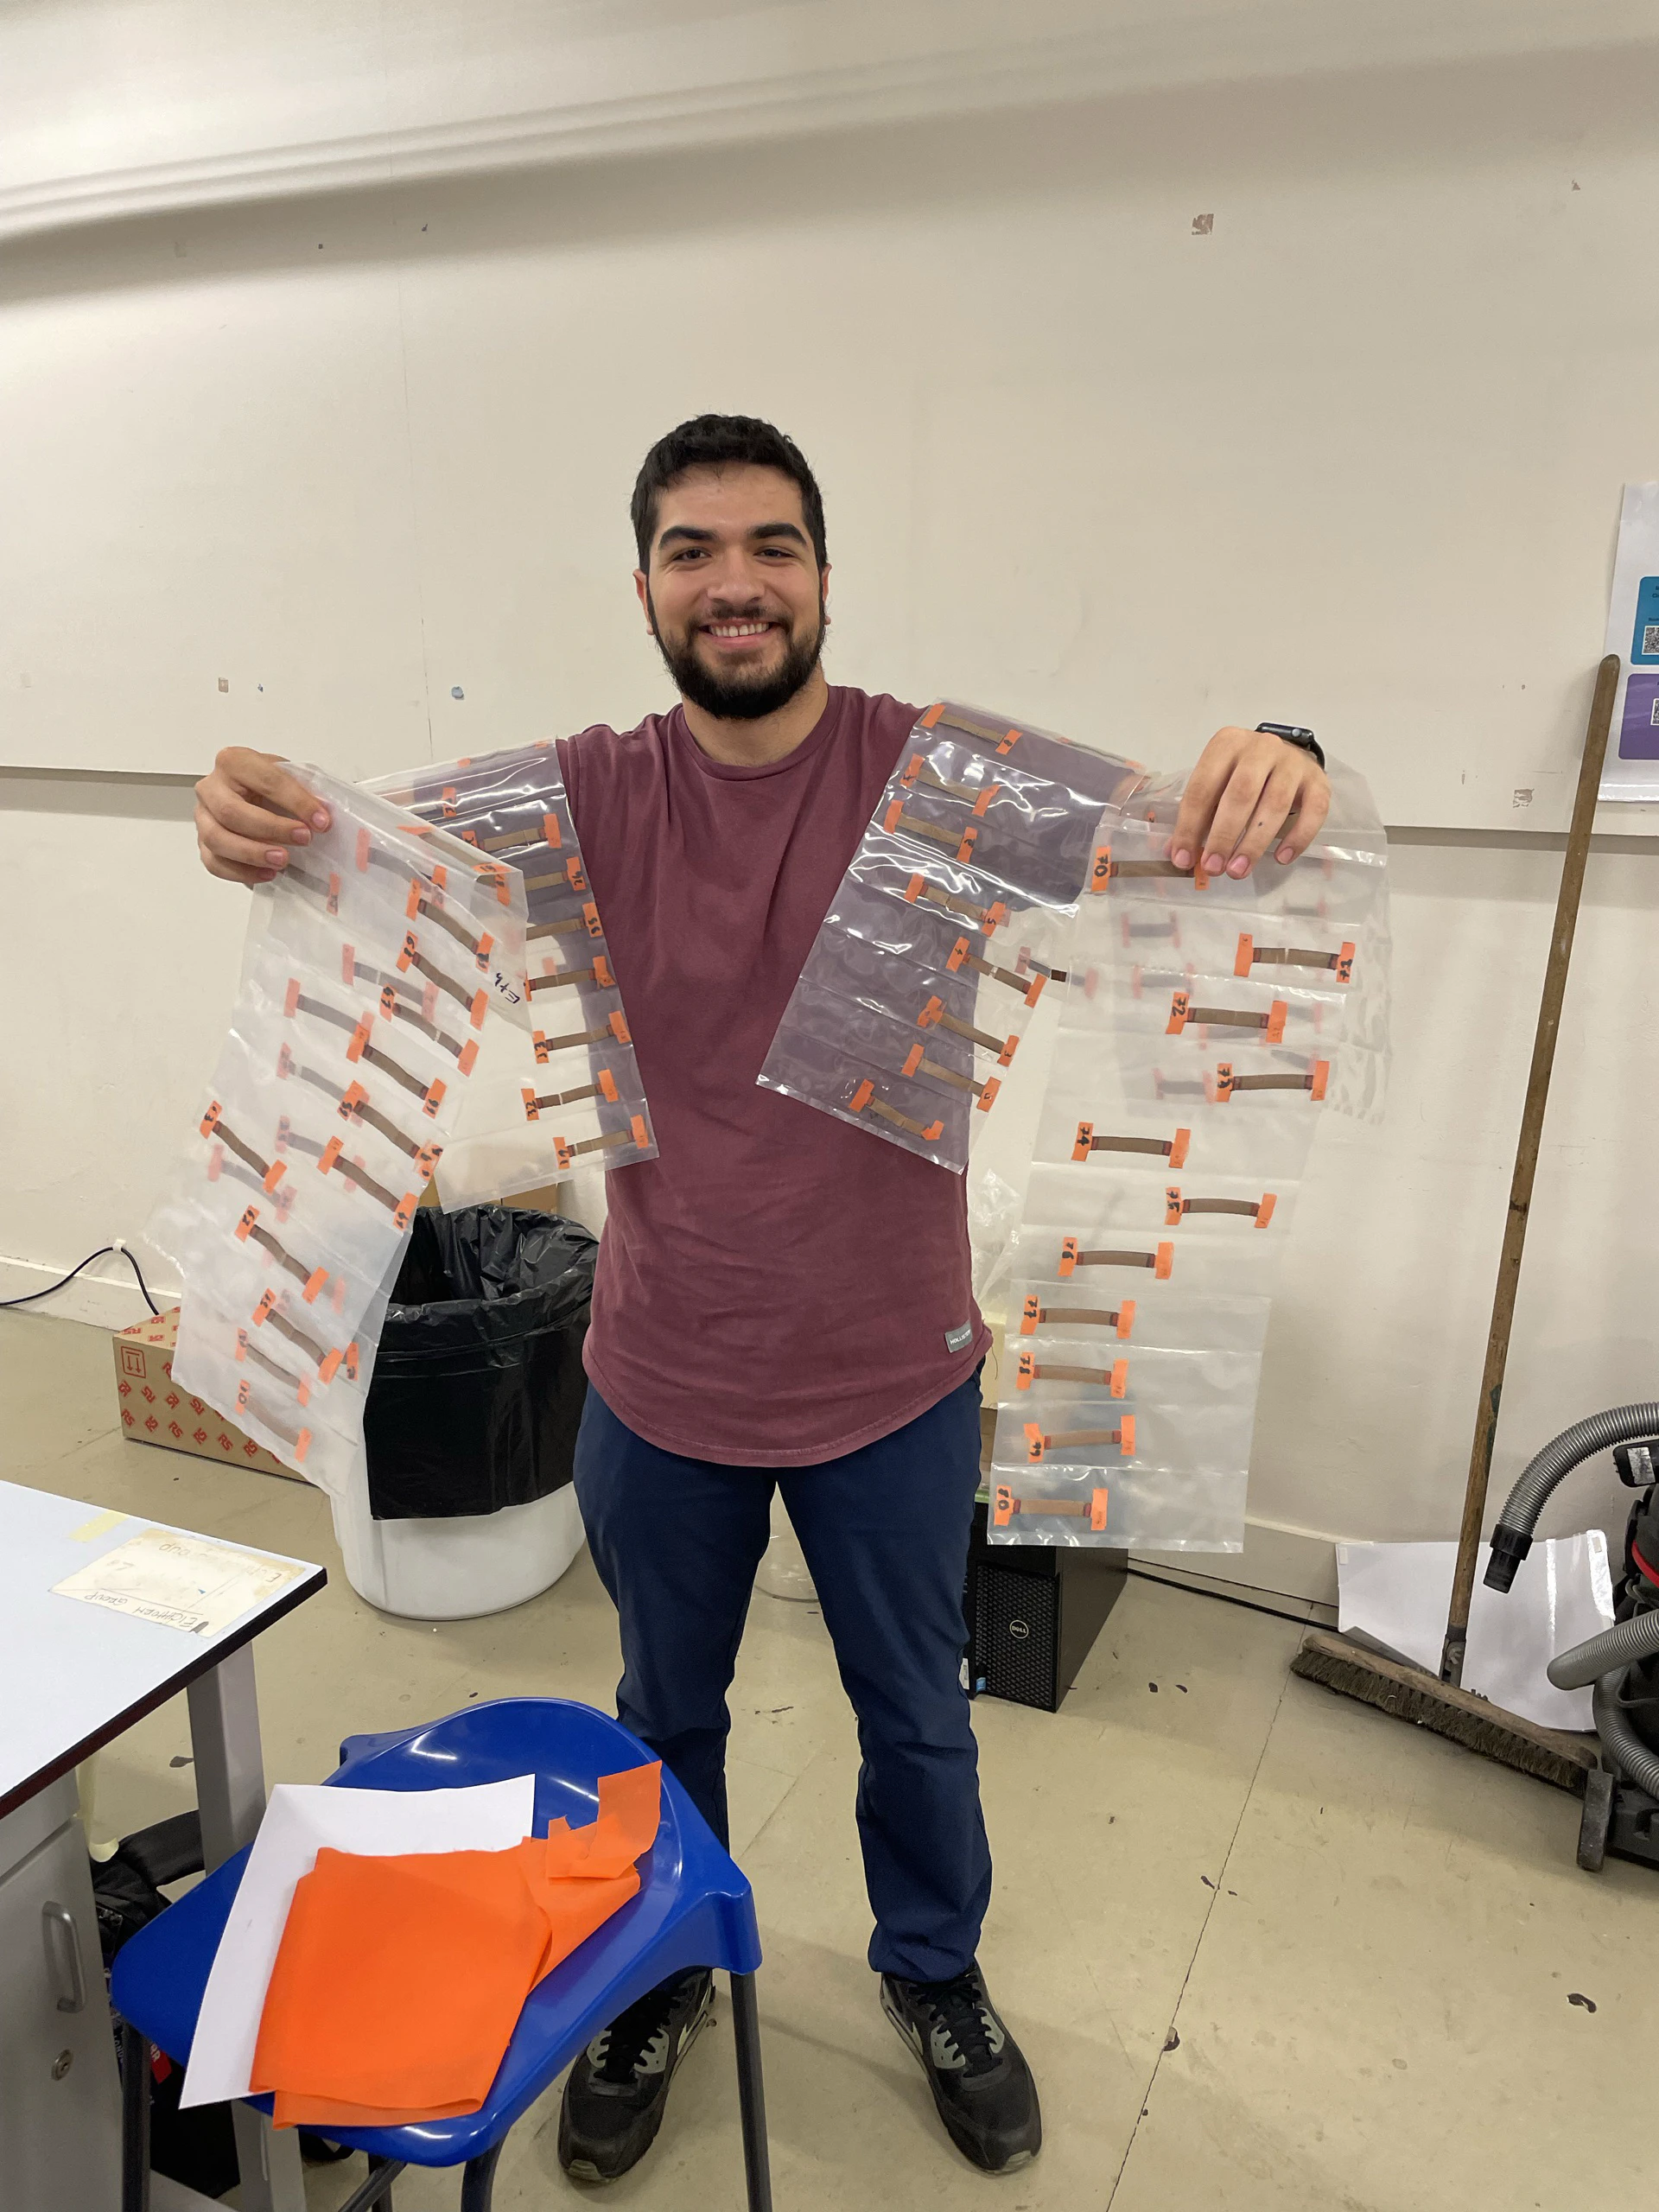
Bagged and labelled humidity-conditioned specimen batches held up in the lab, each strip tagged with orange tape
Conditioned batches, bagged and labelled. 14 Aug 2025.
Five tape-labelled flax/PLA strips on a tray, some frayed at the ends, lying on the risk assessment form for the Shimadzu tests
A labelled batch on the tray, risk assessment underneath.
02

The lab

Every specimen was imaged on all four sides on a Zeiss AXIO Zoom.V16, stitched from tiles in ZEN into scans up to 8192 pixels wide, then pulled to failure on a Shimadzu tensile machine while a camera on an arm tracked its curvature under an LED panel. Force and stroke from the machine, curvature from the camera, the stitched scans as model input: that was the raw material. Lab photos from 30 June and 14 August 2025.
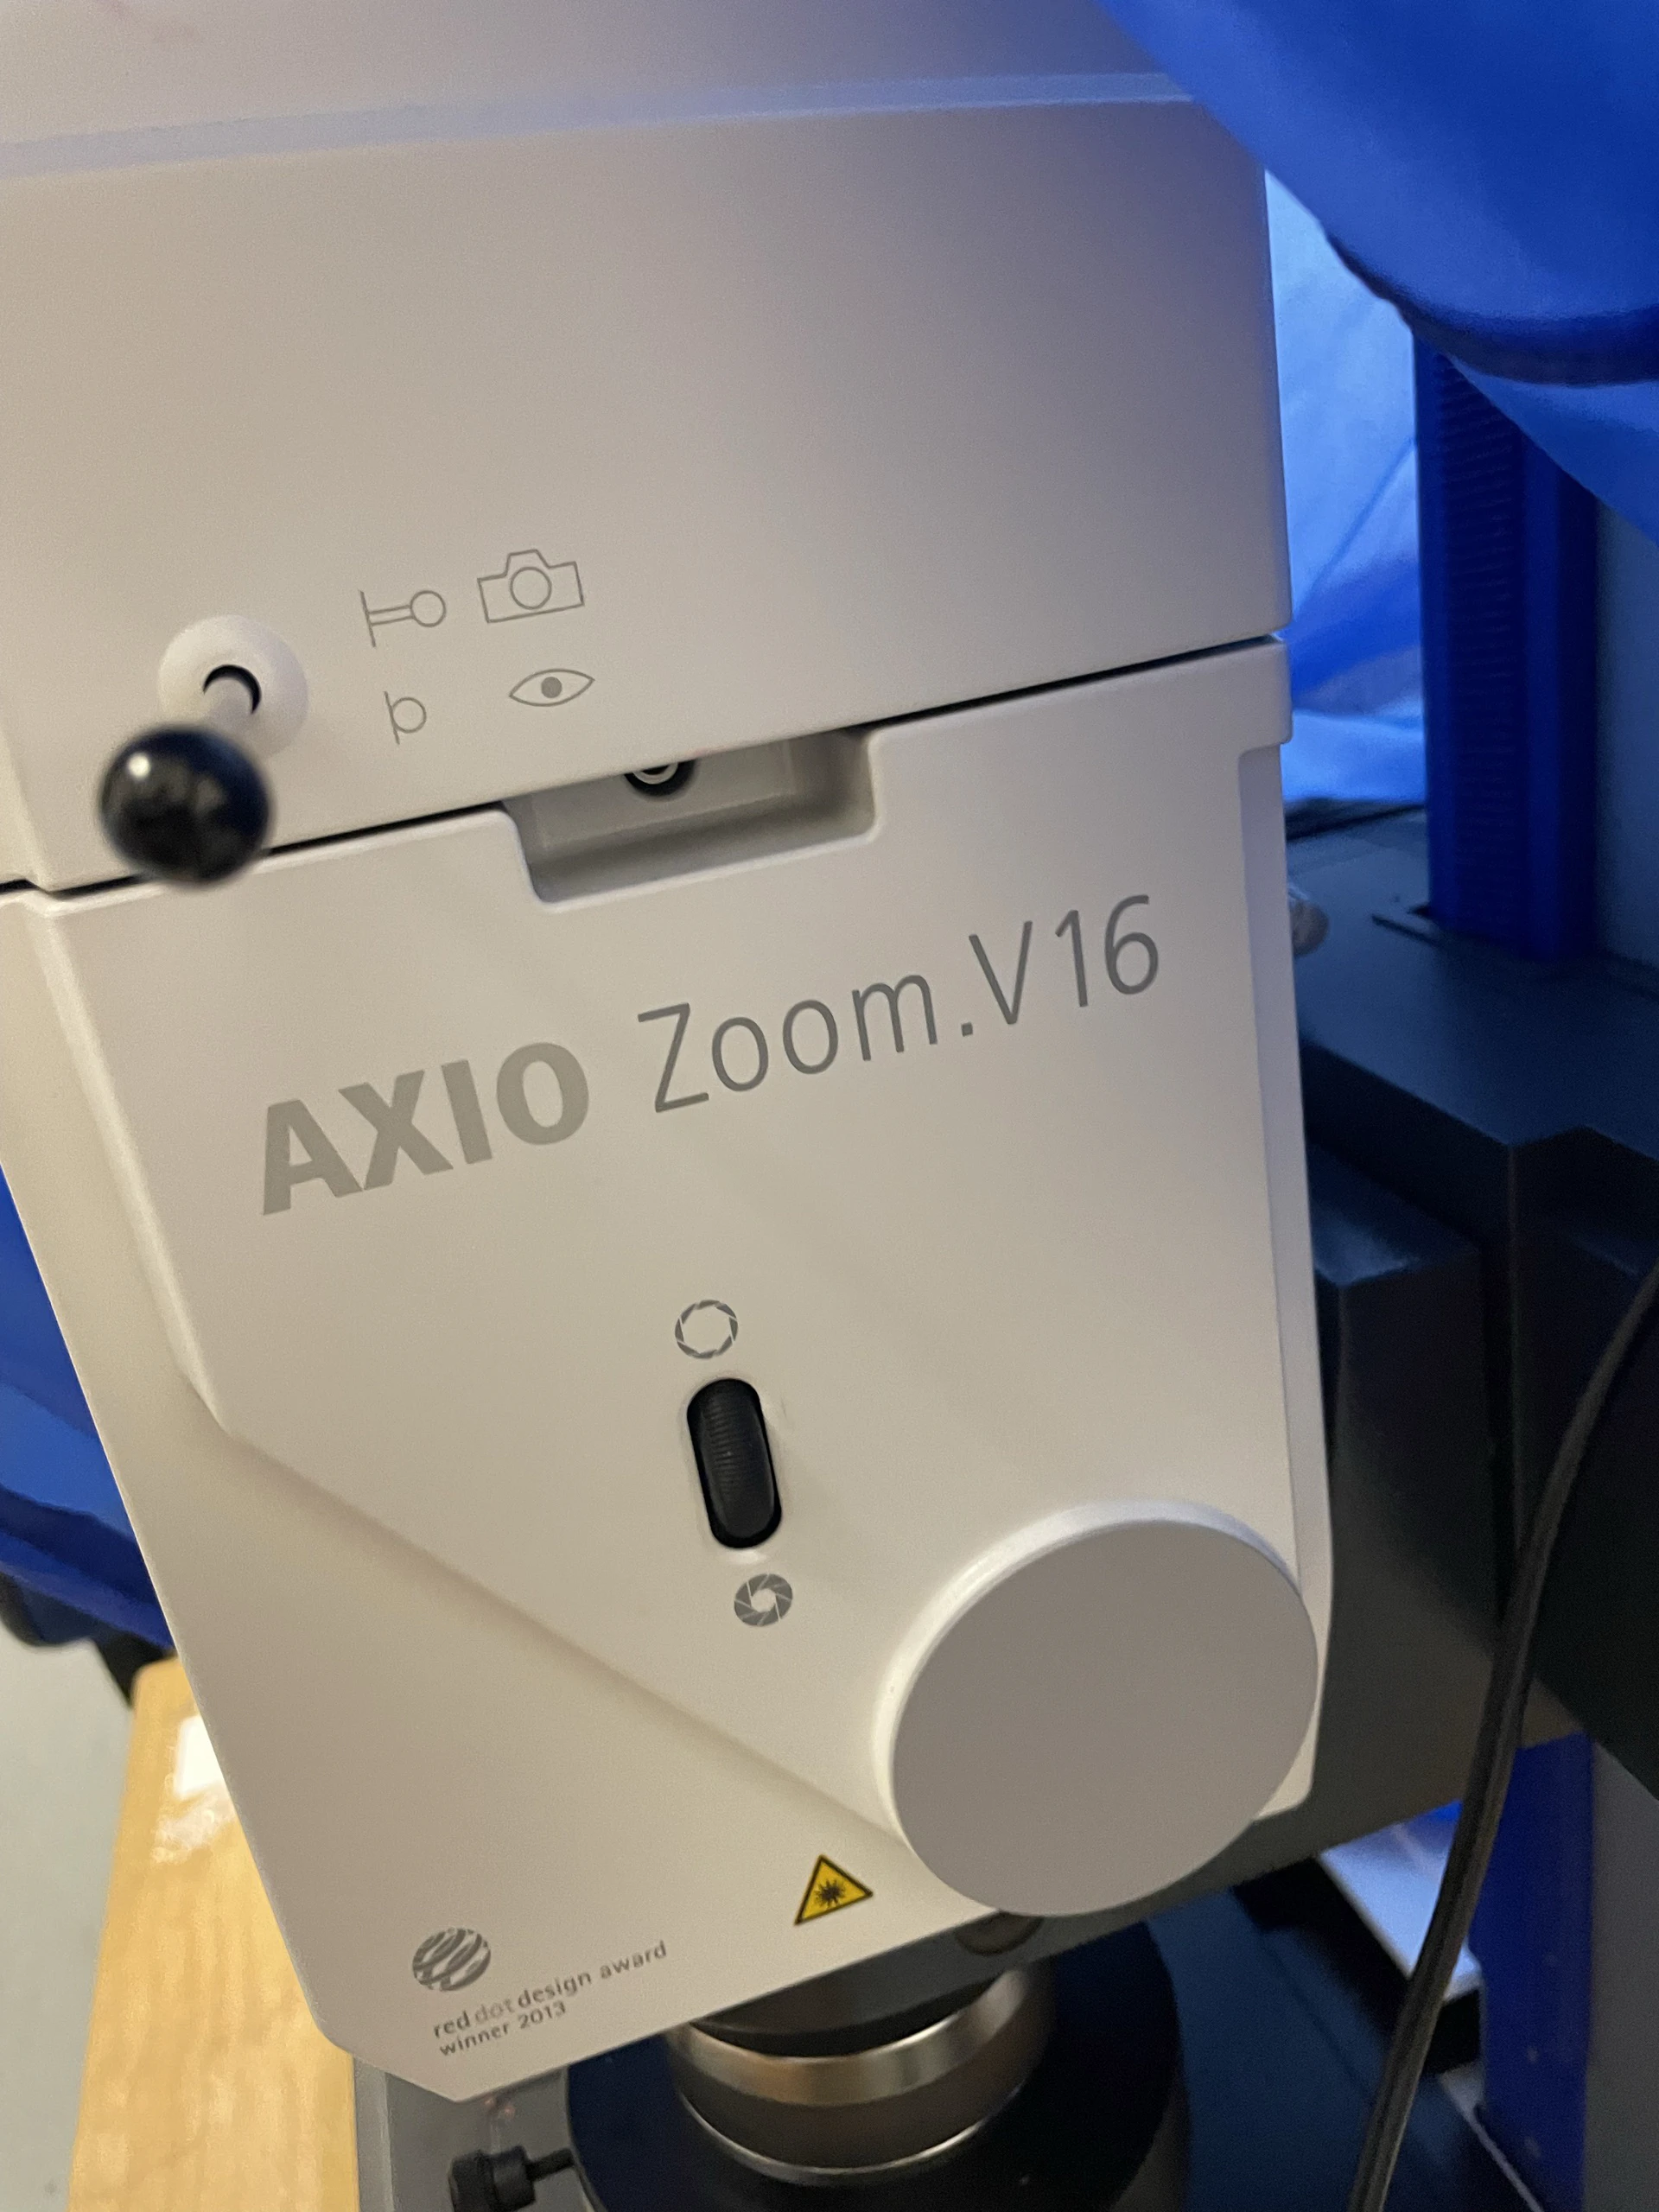
Close-up of the Zeiss AXIO Zoom.V16 microscope head with blue drapes behind
The Zeiss AXIO Zoom.V16 used for the four-side tile scans.
A tile scan captured in ZEN.
Second stitched tile scan of a conditioned specimen with a stronger arc, a thin green fitted outline along its edge
A second scan, stronger arc.
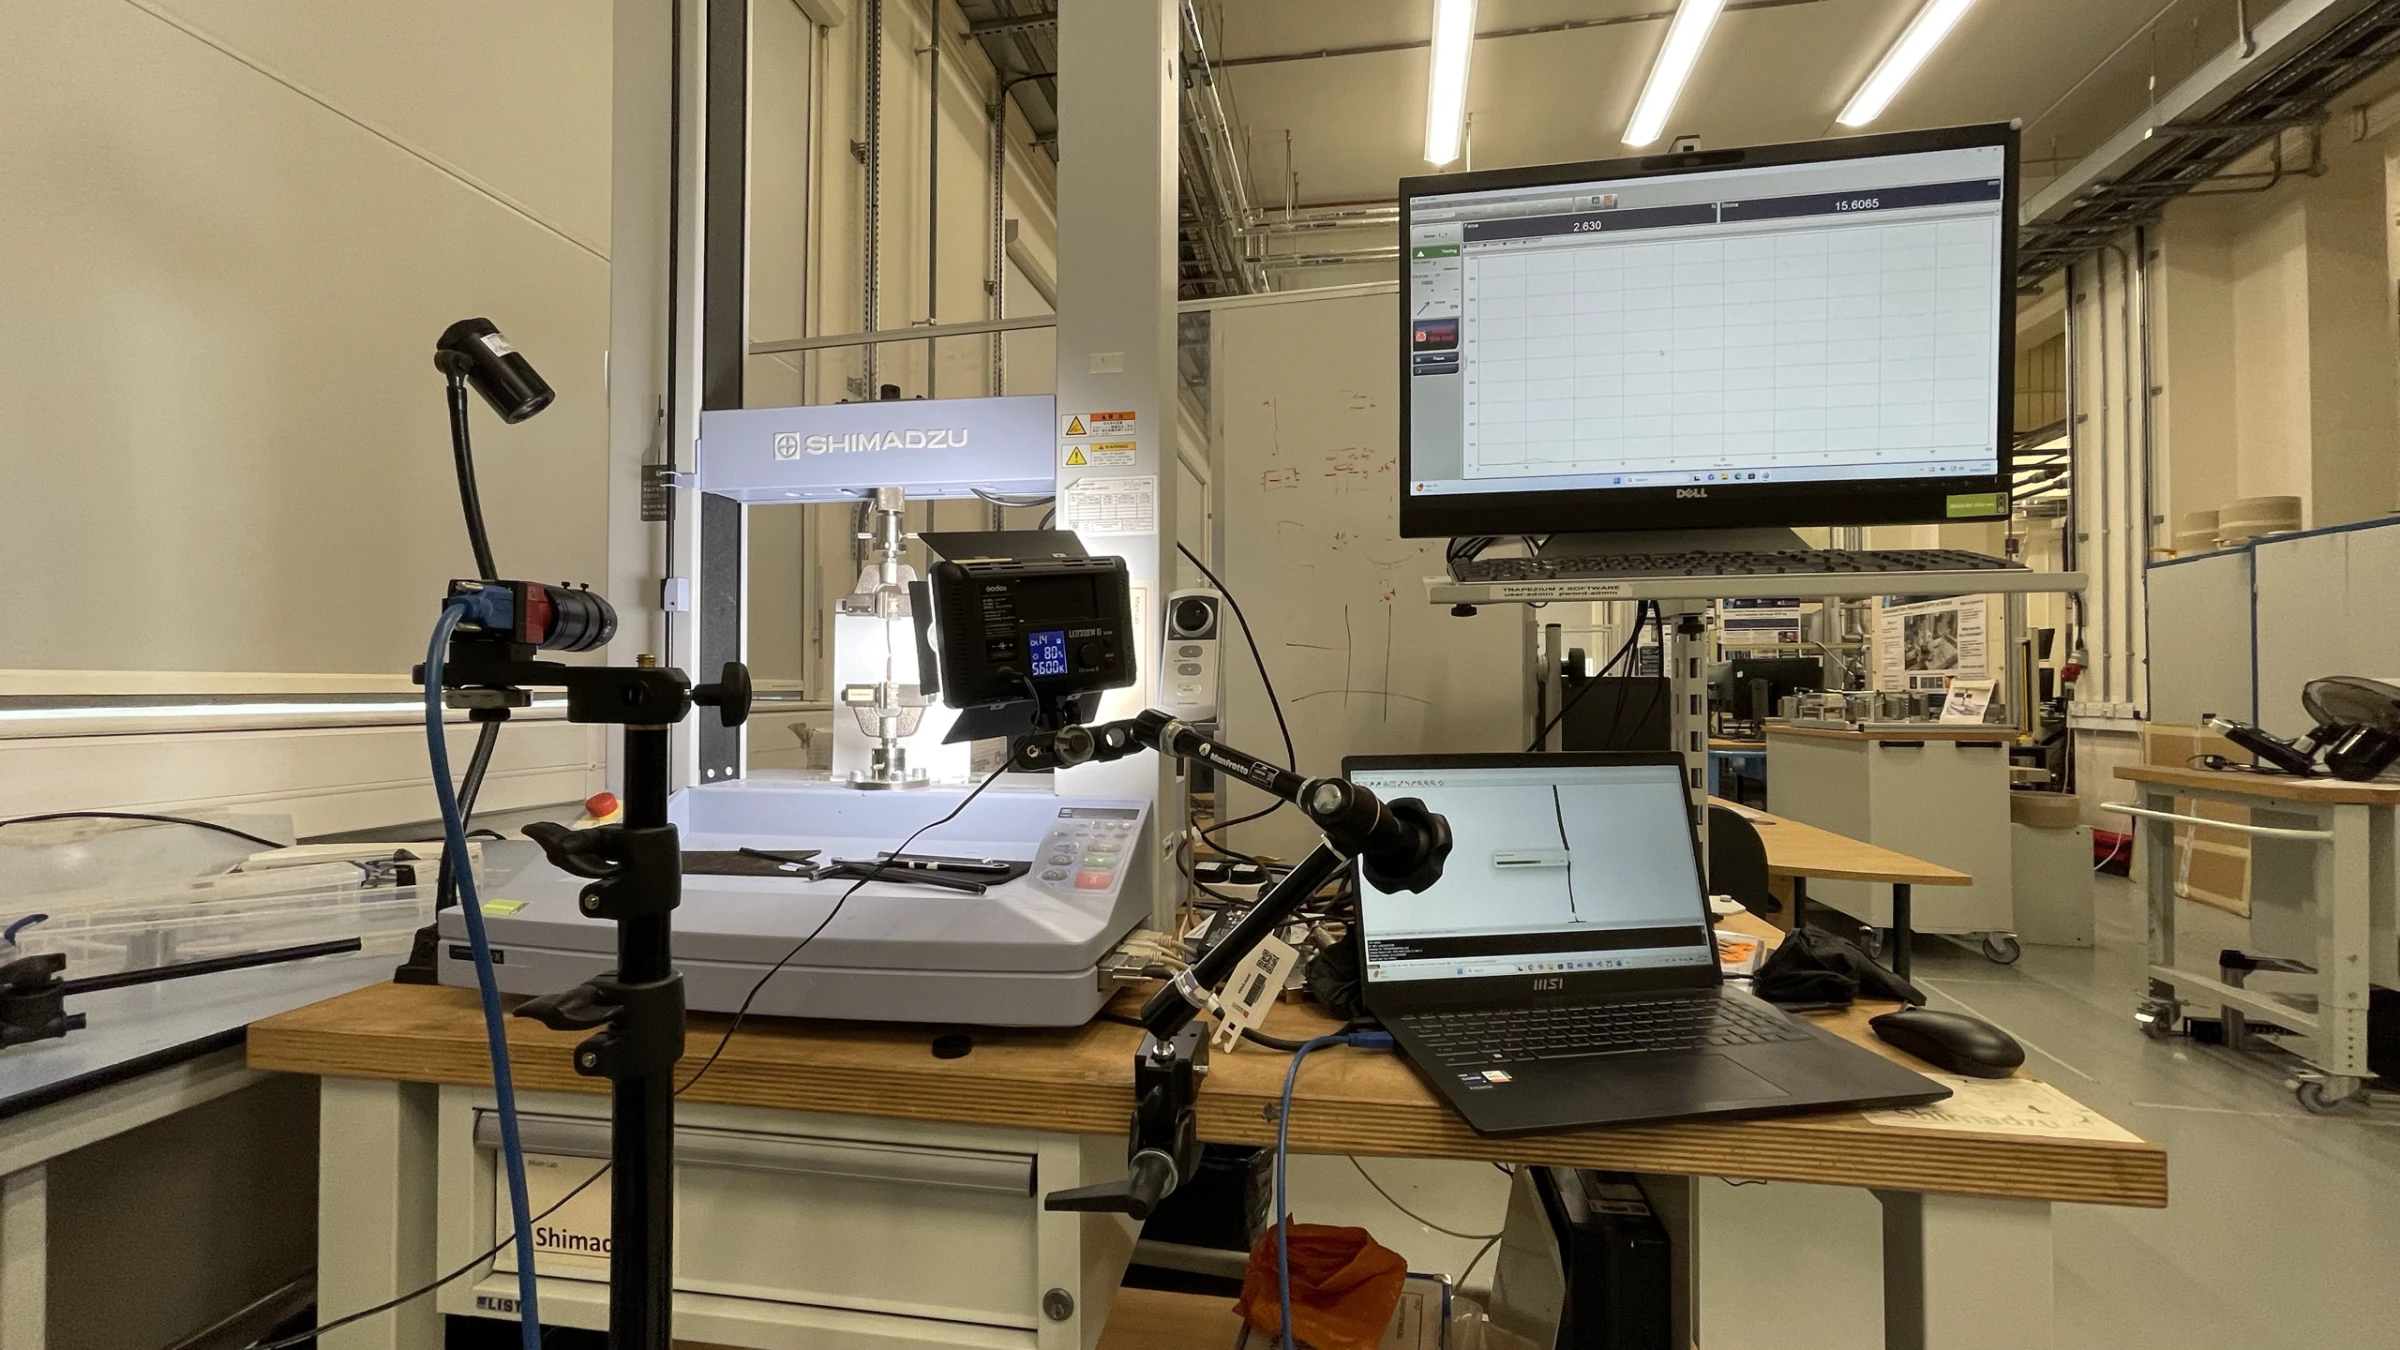
Shimadzu tensile machine on a bench with the camera arm, LED panel, acquisition laptop and a live force-displacement trace on the monitor
The test station: machine, camera arm, live force-displacement trace.
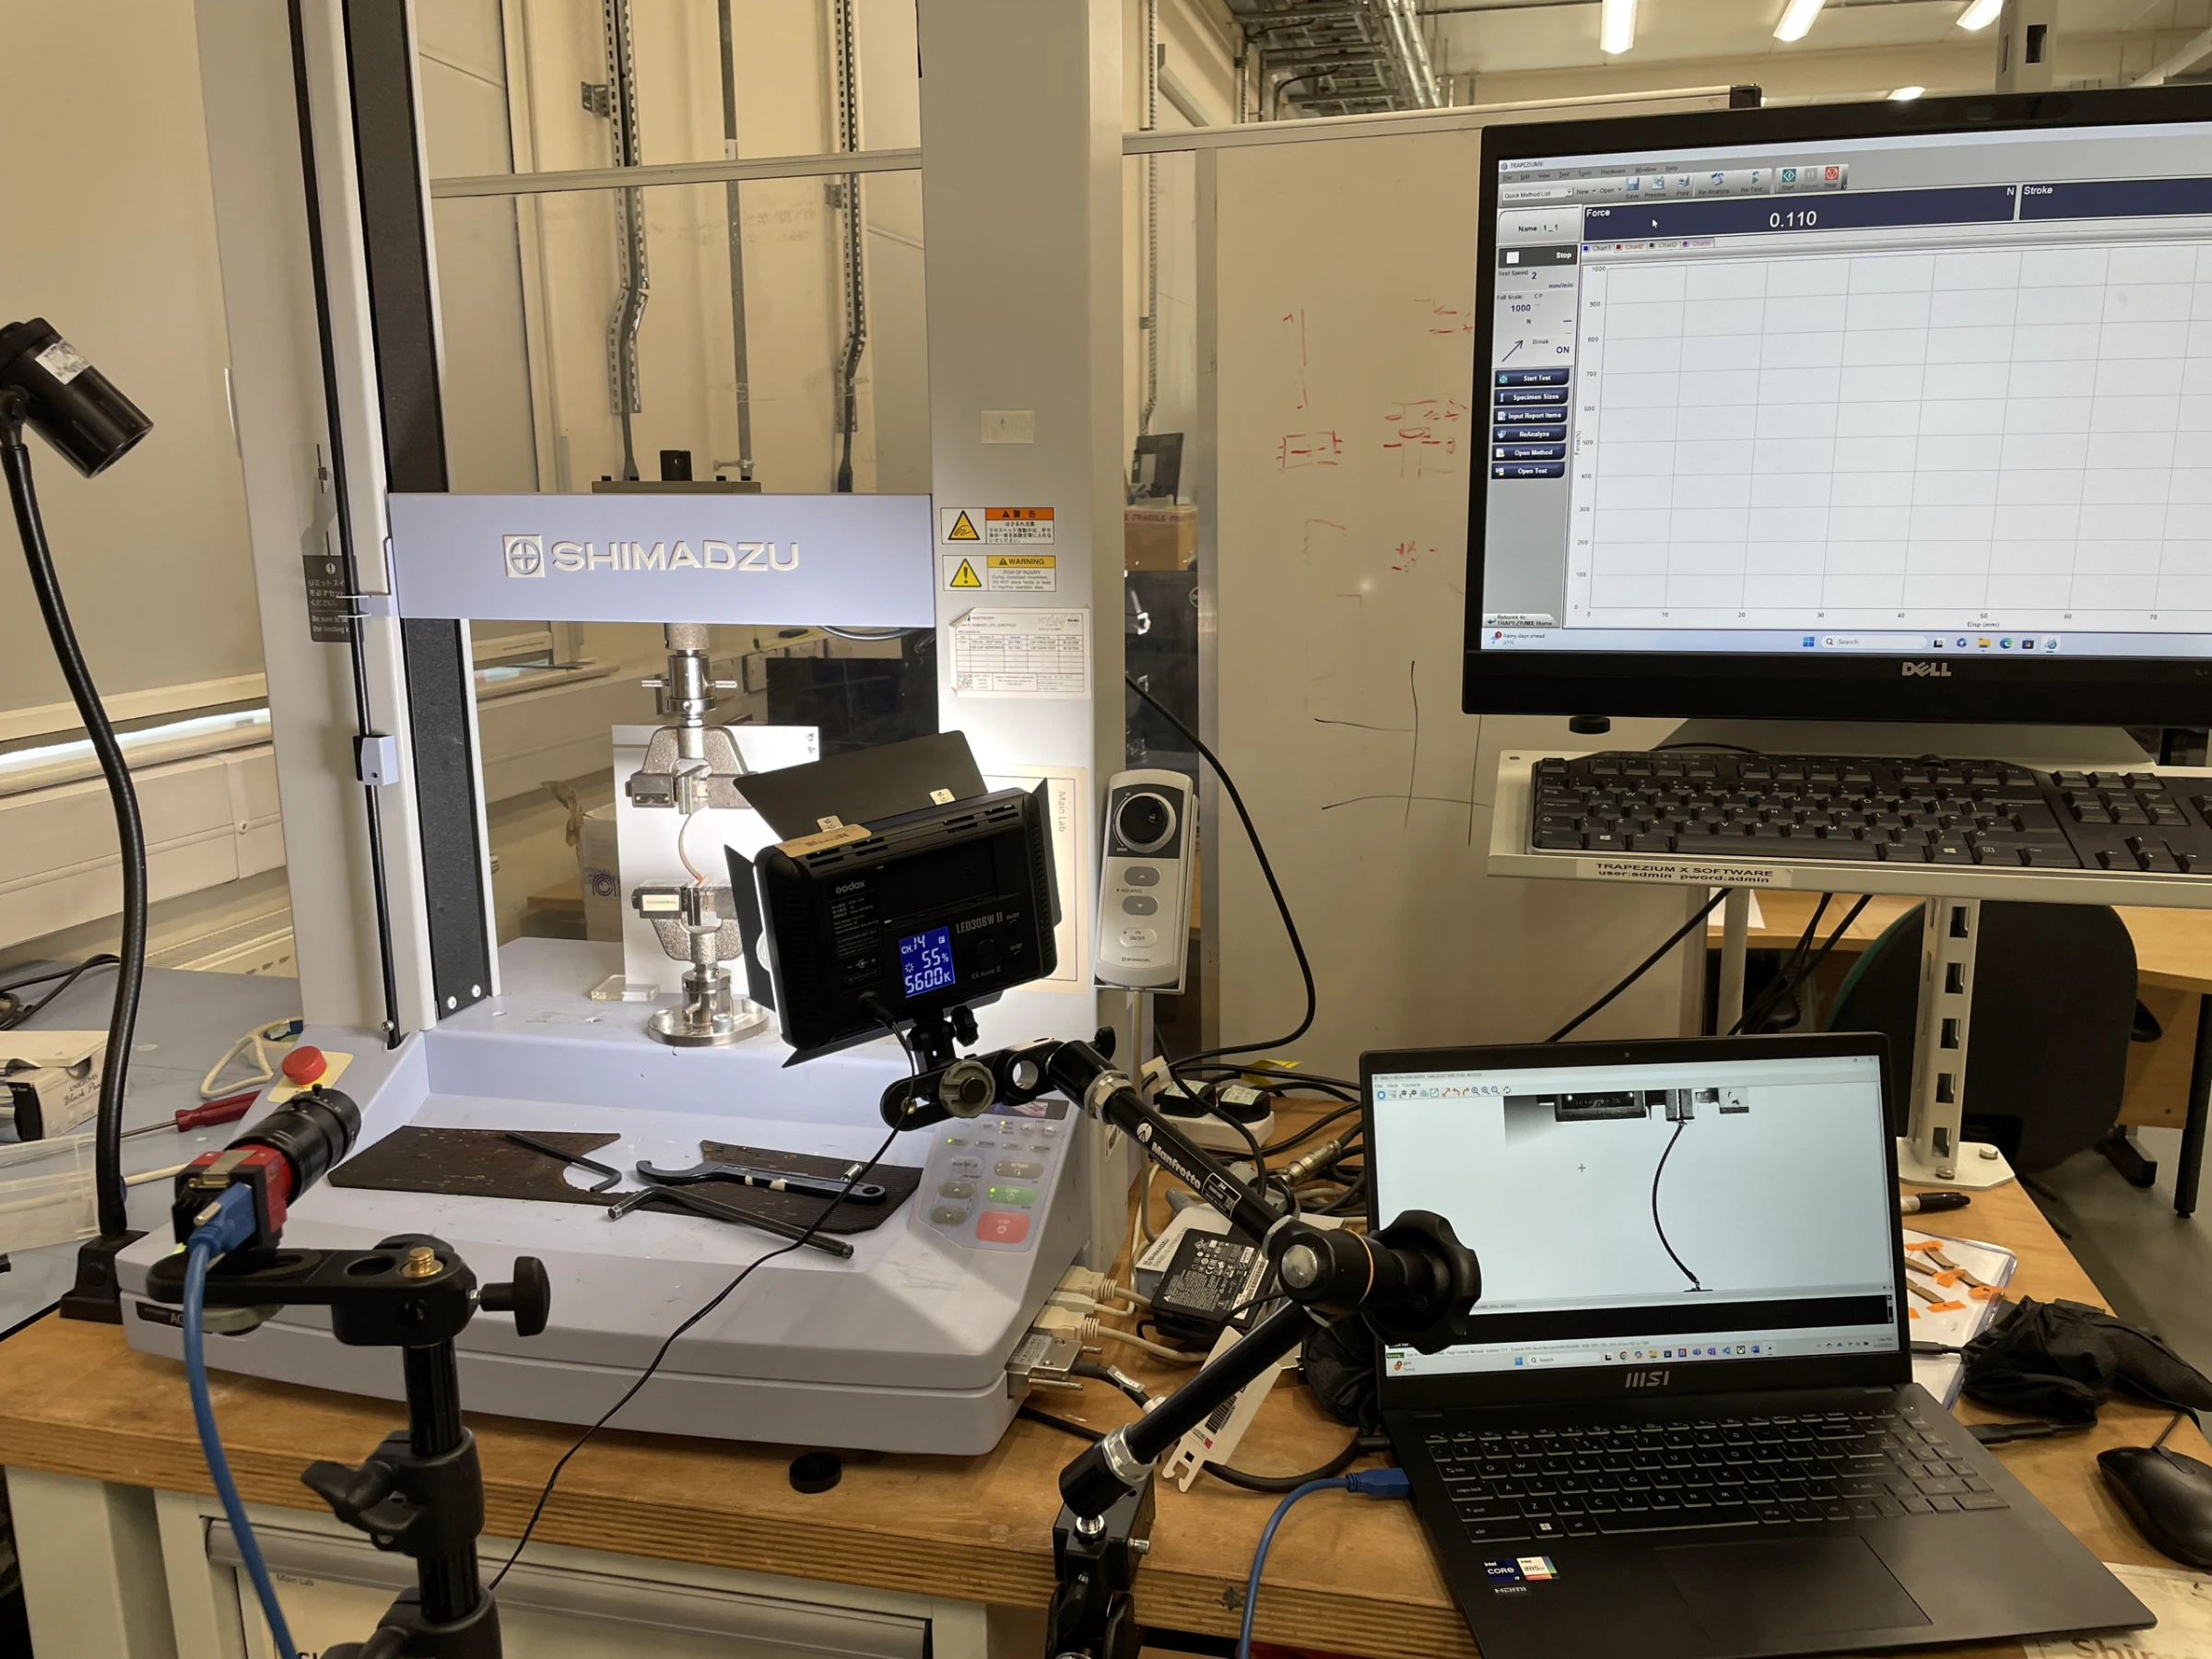
Closer view of the Shimadzu machine with the LED light panel, curvature-tracking camera and a laptop showing the specimen outline
Curvature-tracking camera and light rig on the Shimadzu.
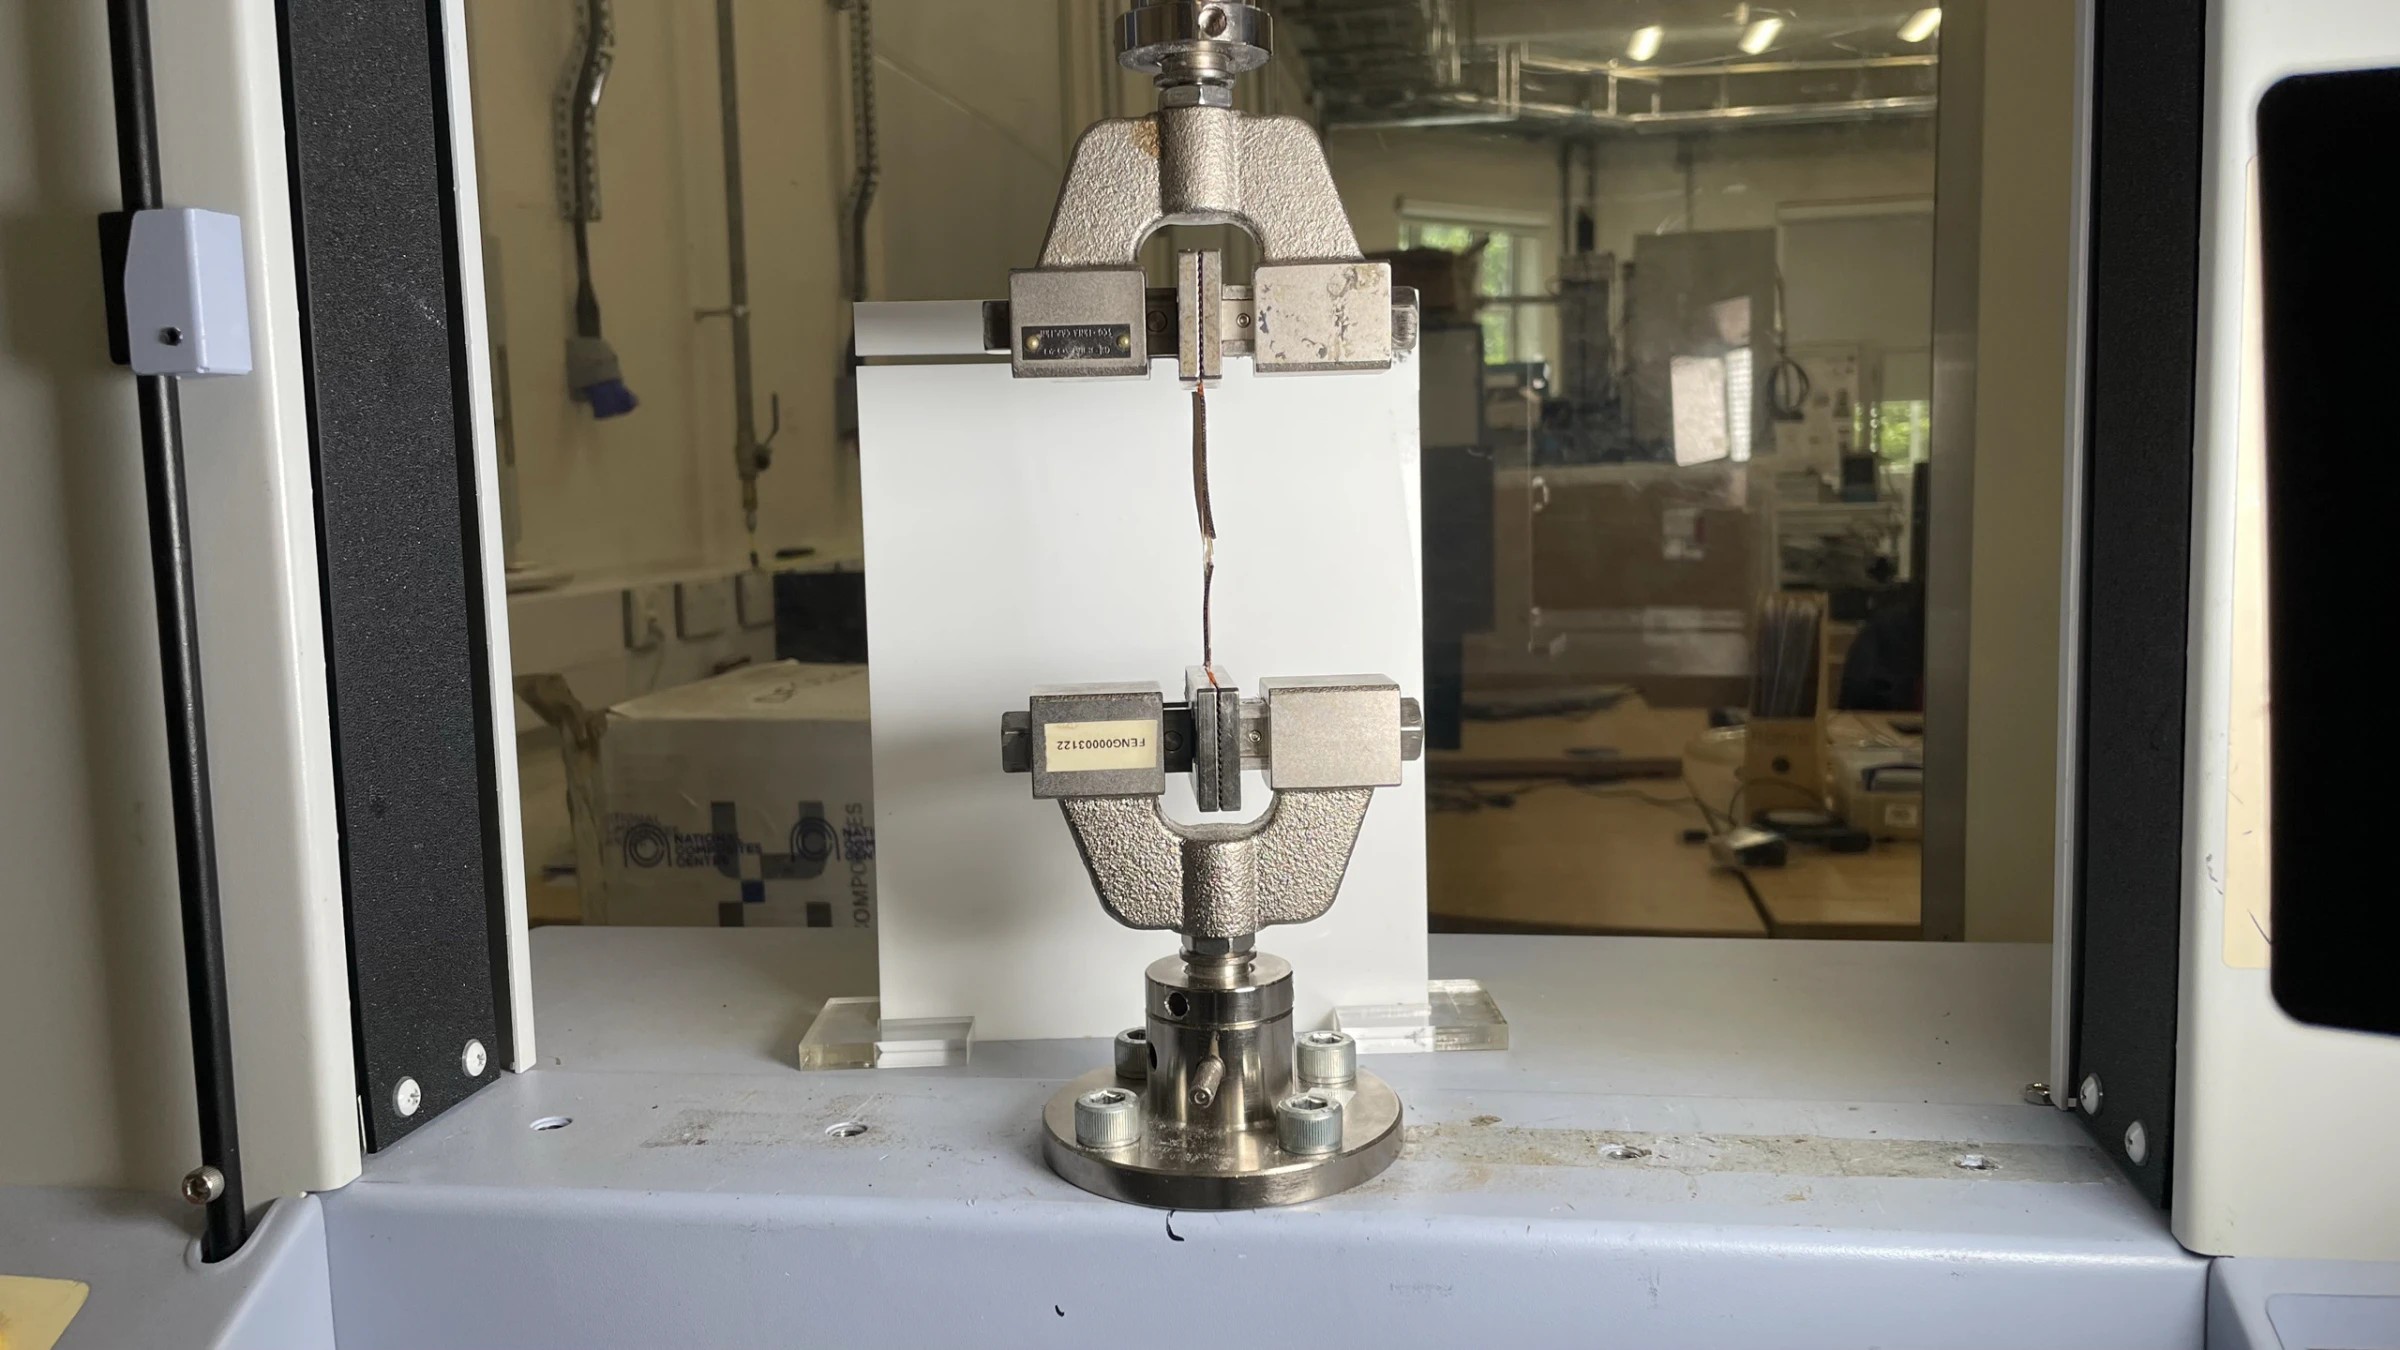
A thin flax/PLA strip held in the tensile grips against a white board, its curvature visible
Flax/PLA strip in the grips mid-test.
Pan across the rig during a live test.
Second pan, wider.
03

v1: a CNN that looked right

The first model took the four microscope orientations as input and produced the stress plot directly: a ResNet18 encoder into a U-Net decoder, image in, image out. The predictions looked plausible against ground truth and the summer ended there. When I came back to it and rebuilt the evaluation properly, with frozen splits and a research-grade protocol, the first thing it found was a test-set leak. The score that had looked good was not measuring generalisation. I killed it and started again from the physics.
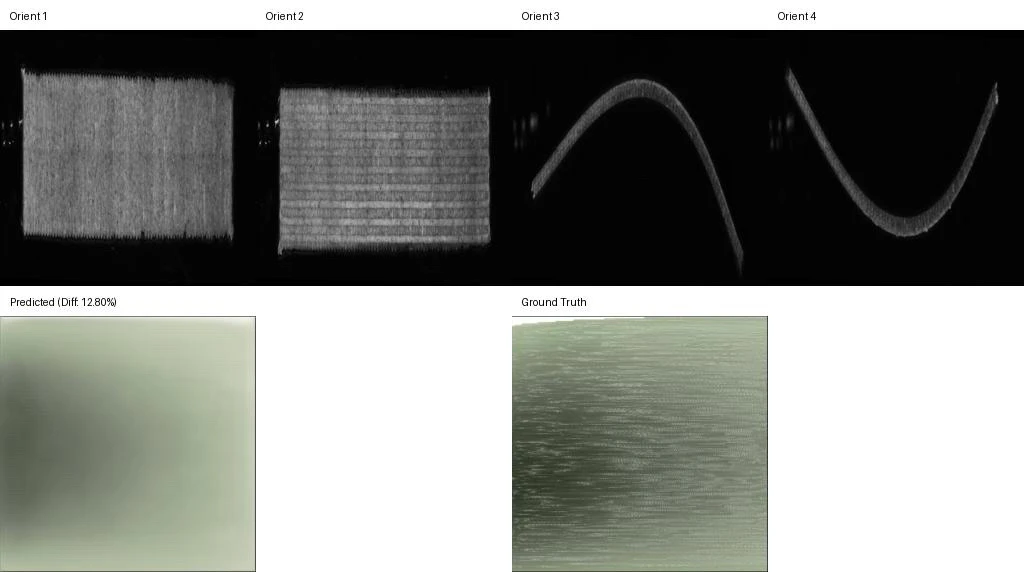
Four microscope orientations of one specimen above a predicted stress plot and the ground-truth plot, visually similar
v1 image-input CNN: four microscope orientations in, stress plot out, against ground truth.
04

v2: the shape transfers, the scale does not

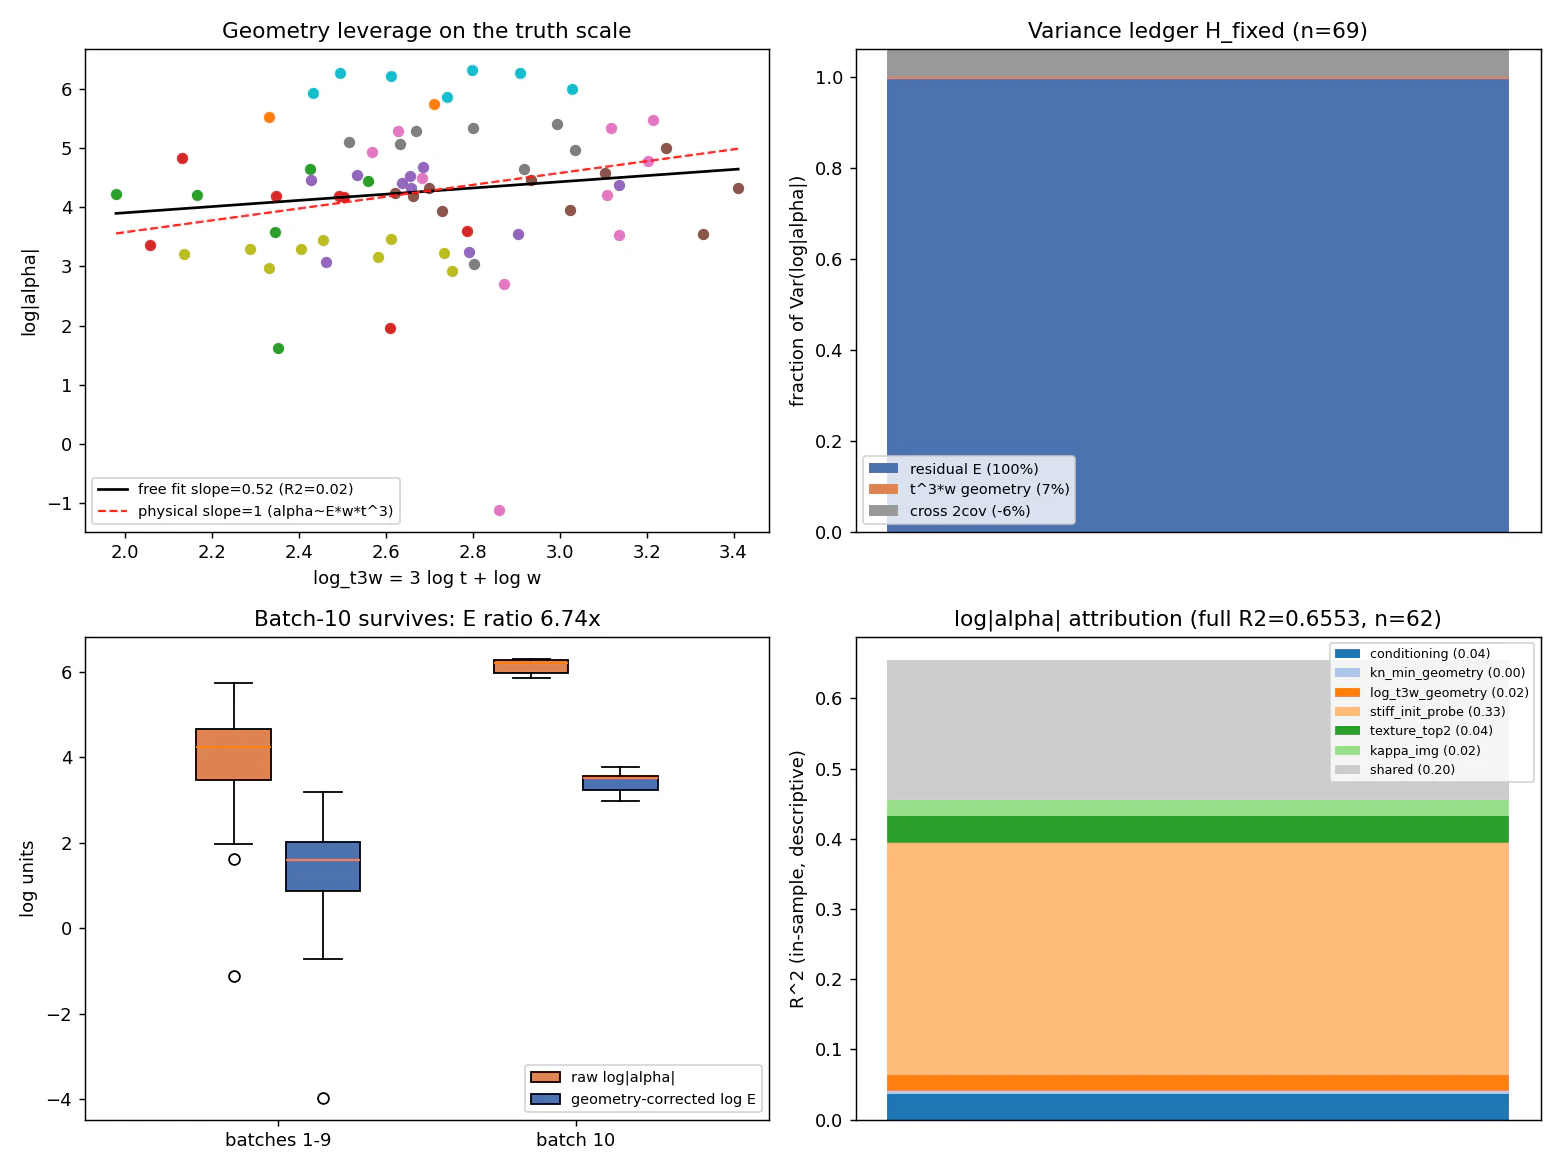
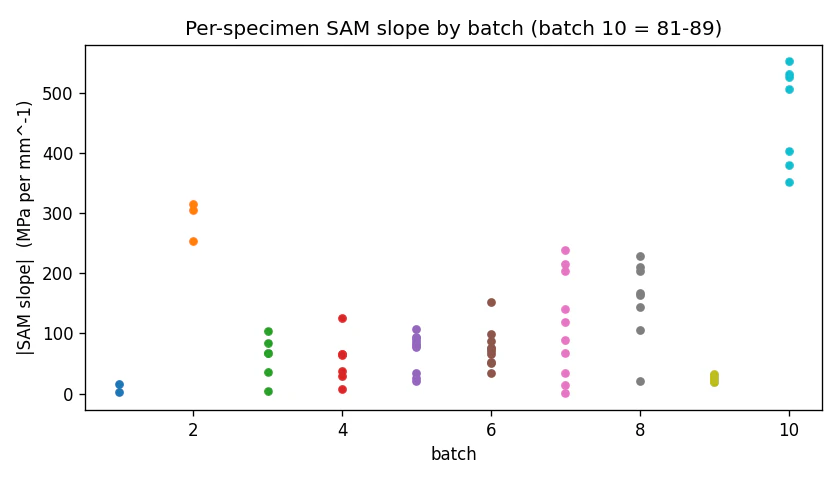
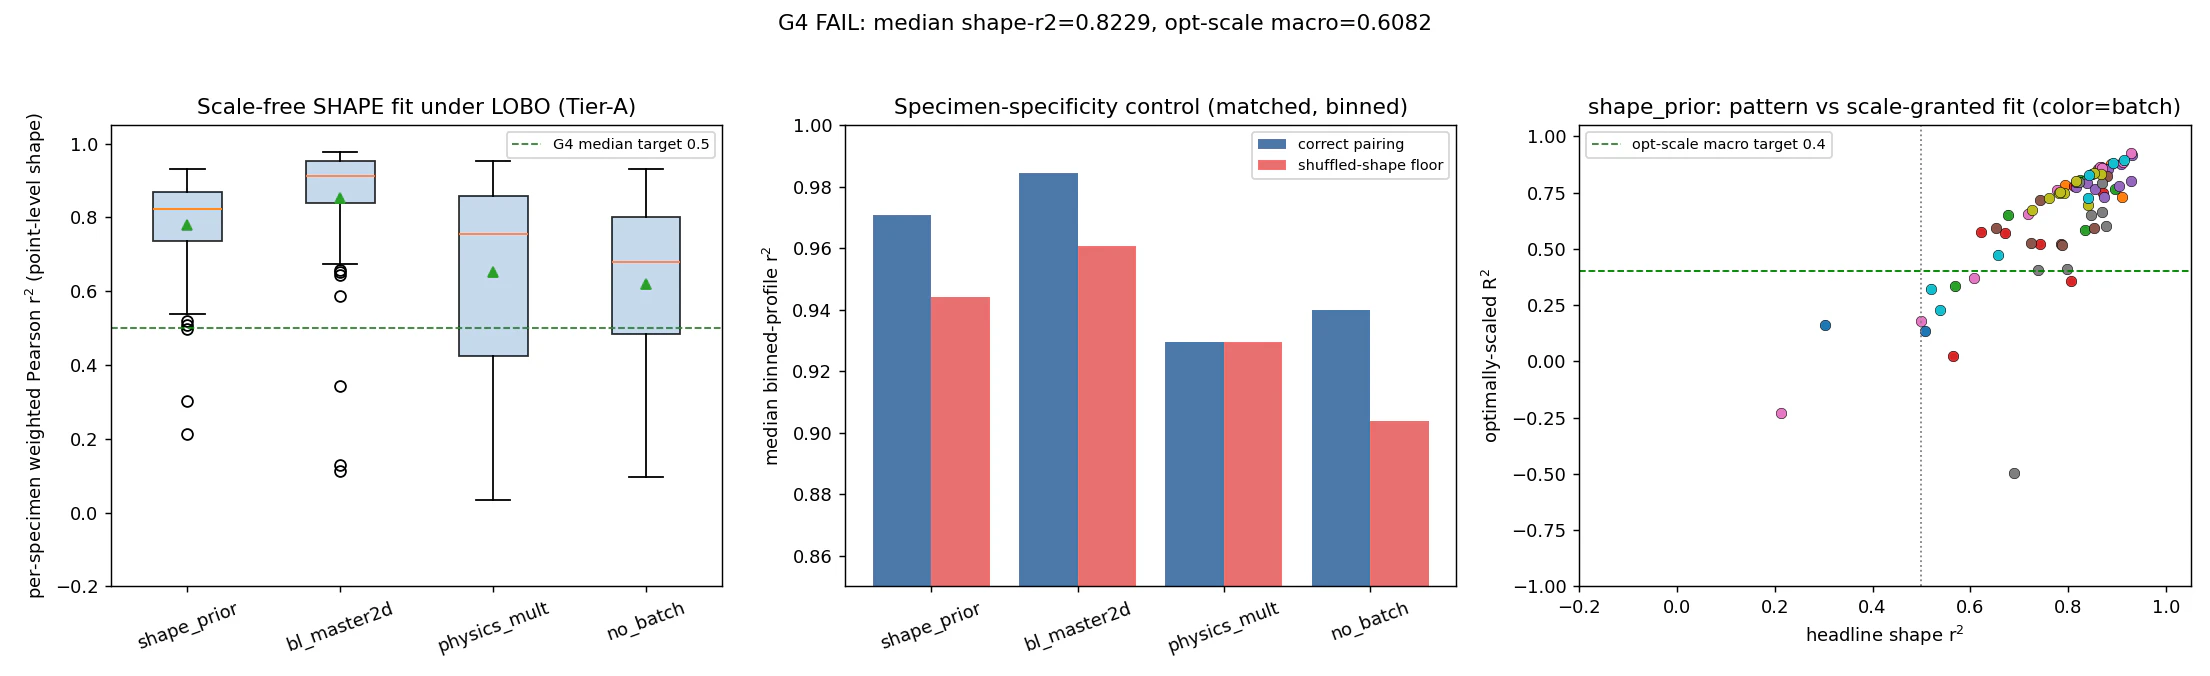
v2 is a physics-structured coordinate MLP: stress as a function of curvature change and position along the strip, not of pixels, evaluated leave-one-batch-out. The map factorises, σ ≈ α · m(Δκ, s). Divide each specimen's field by its own scale α and all 72 collapse onto one master curve, pooled R² 0.92, and the shape transfers to a batch the model has never seen, scale-free r² 0.82. The scale does not. α spans 30 to 50 times across the dataset, about a third of that variance sits between batches, and geometry explains only about 7 percent: the scatter is real material modulus. Point prediction is R² 0.69 with the batch seen and roughly zero with it held out, for every method I tried, DANN and GroupDRO included. Capacity was not the lever.
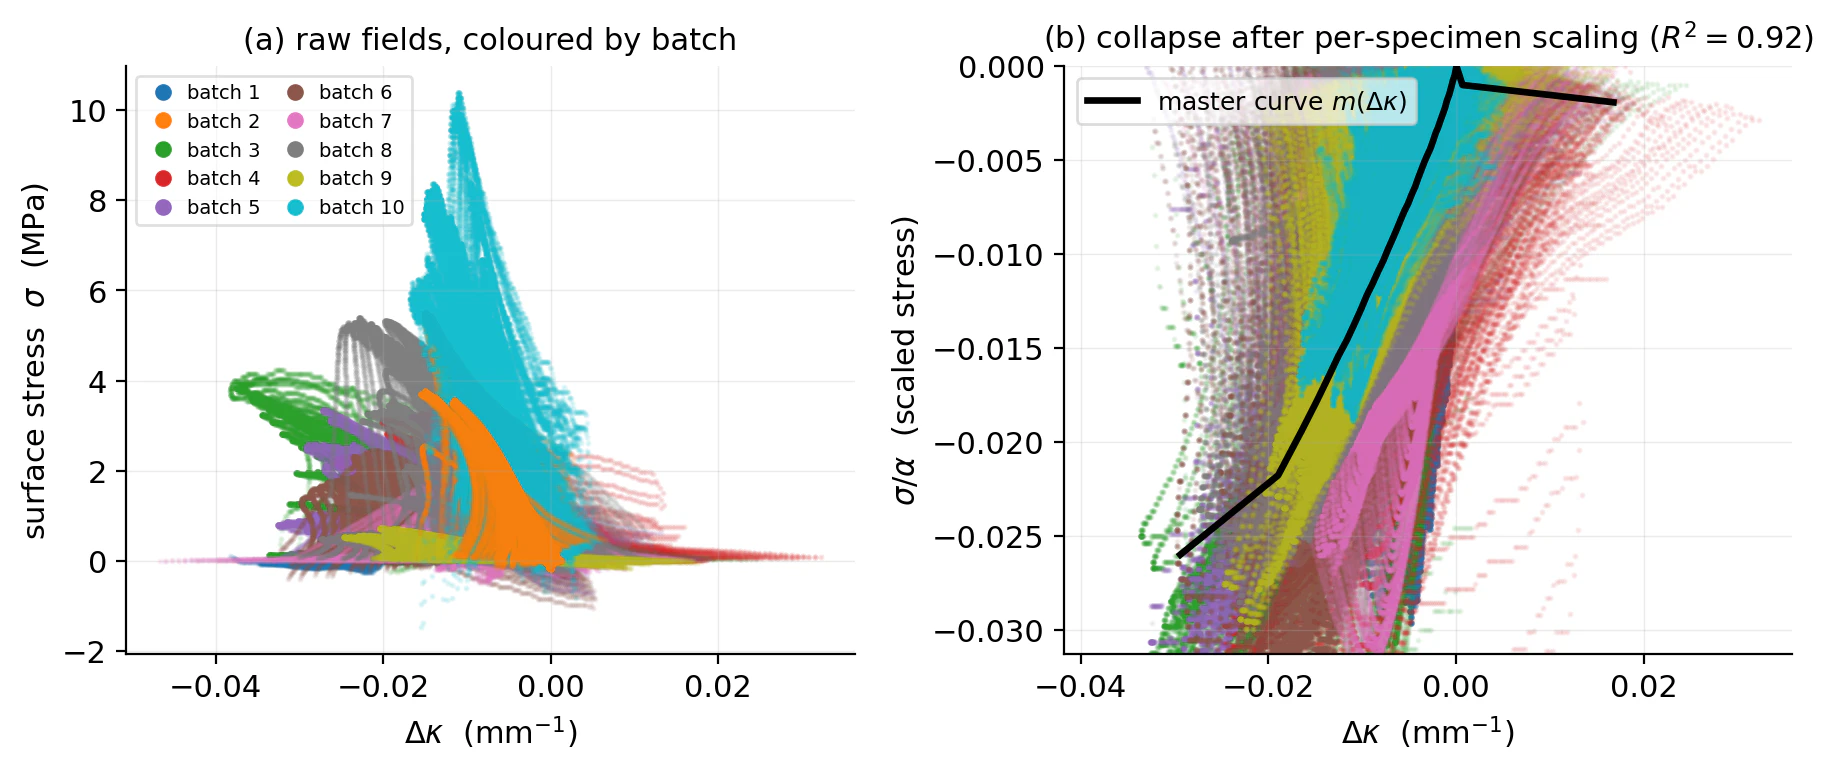
Two panels: raw stress against curvature change coloured by batch as a tangle of ten colours, then the same data collapsing onto one black master curve after per-specimen scaling
Raw fields coloured by batch, then collapsed onto one master curve after per-specimen scaling. R² 0.92.
Three panels of the scale-free shape transfer test: box plots of per-specimen r² by method, matched against shuffled-shape control bars, and a scatter of optimal-scale R² against headline shape r²
Scale-free shape transfer to unseen batches: 0.82 trained net, 0.91 binned master.
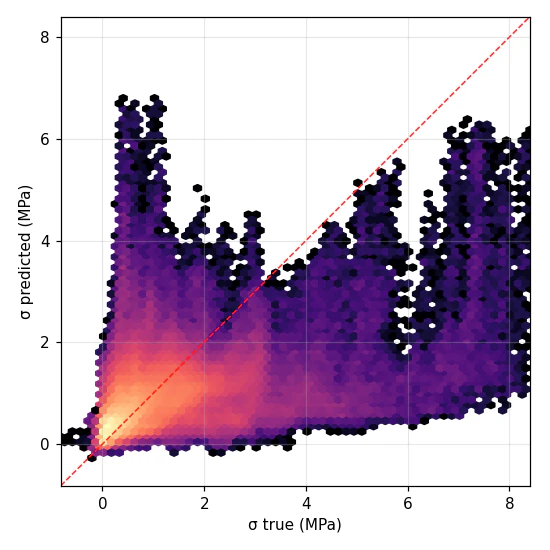
Hexbin density of predicted against true stress with a dashed identity line, dense near zero and spreading at higher stress
Predicted against true stress, first-pass v2.
Four panels decomposing the variance of log stiffness: a scatter against log geometry, a stacked ledger with geometry at 7 percent, batch 10 box plots before and after geometry correction, and an attribution bar
Variance decomposition of log α. Geometry explains about 7 percent; batch 10 survives correction at 6.7×.
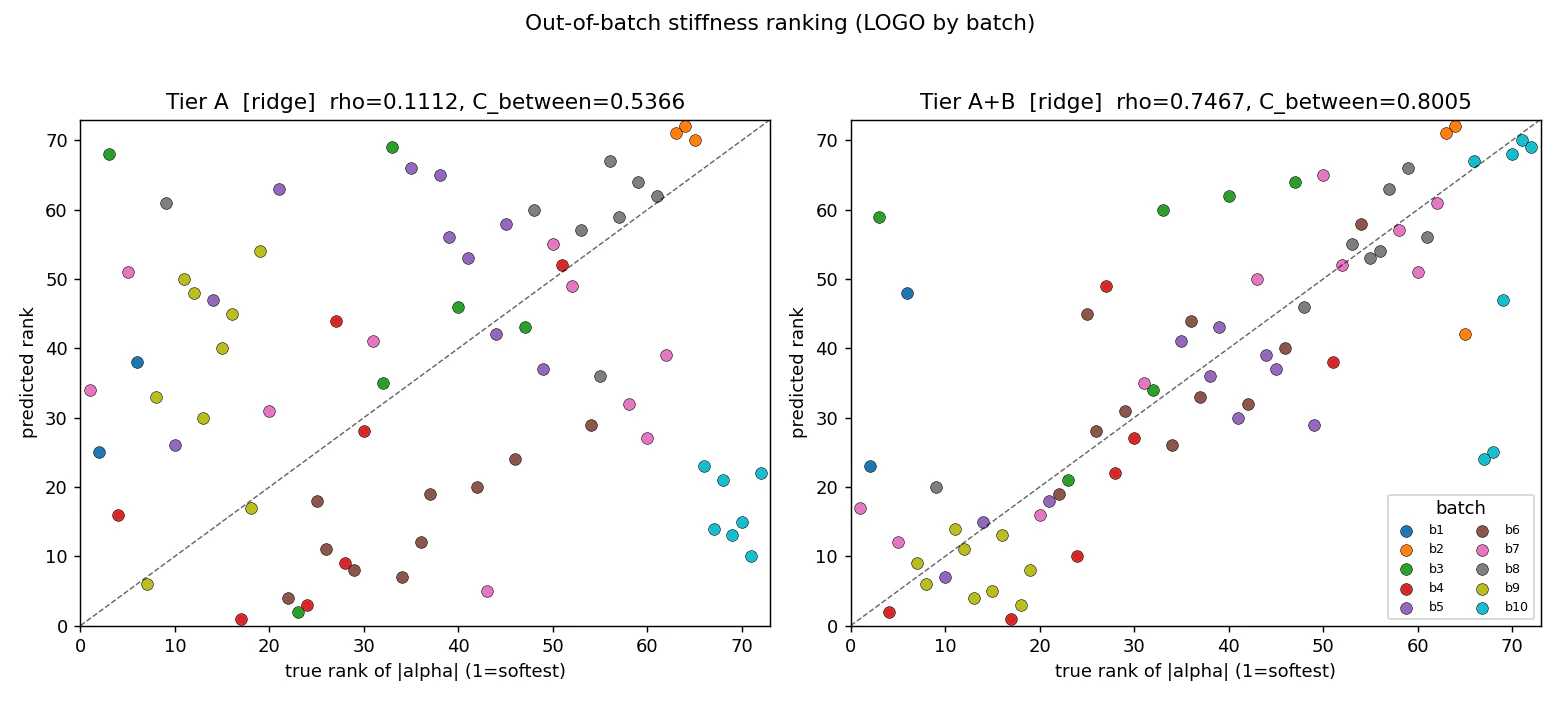
Two scatter plots of predicted against true stiffness rank across 72 specimens: a cloud with no measurement, a tight diagonal with one probe
Out-of-batch stiffness ranking: zero-measurement ρ 0.11, one probe ρ 0.75.
05

One probe recovers the scale

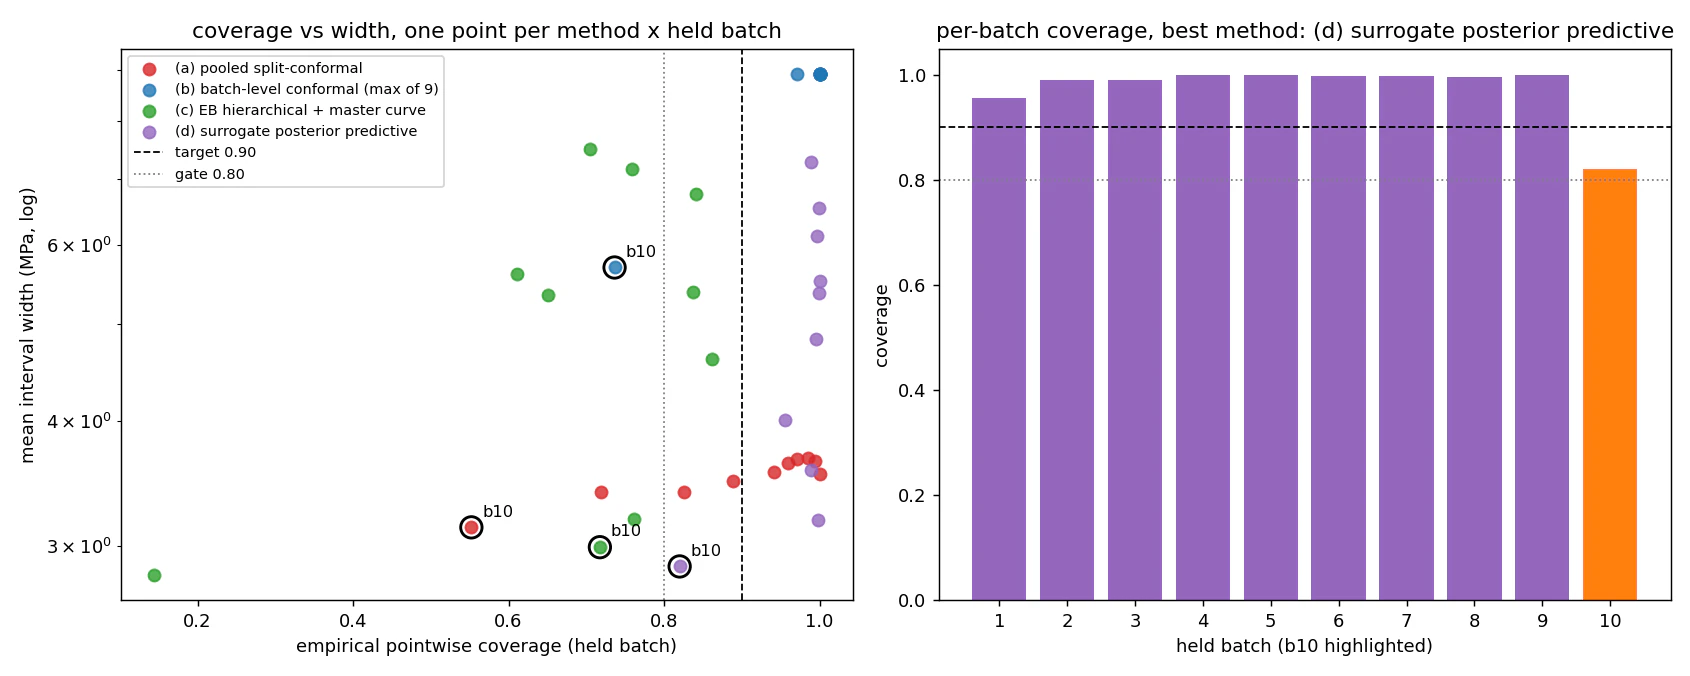
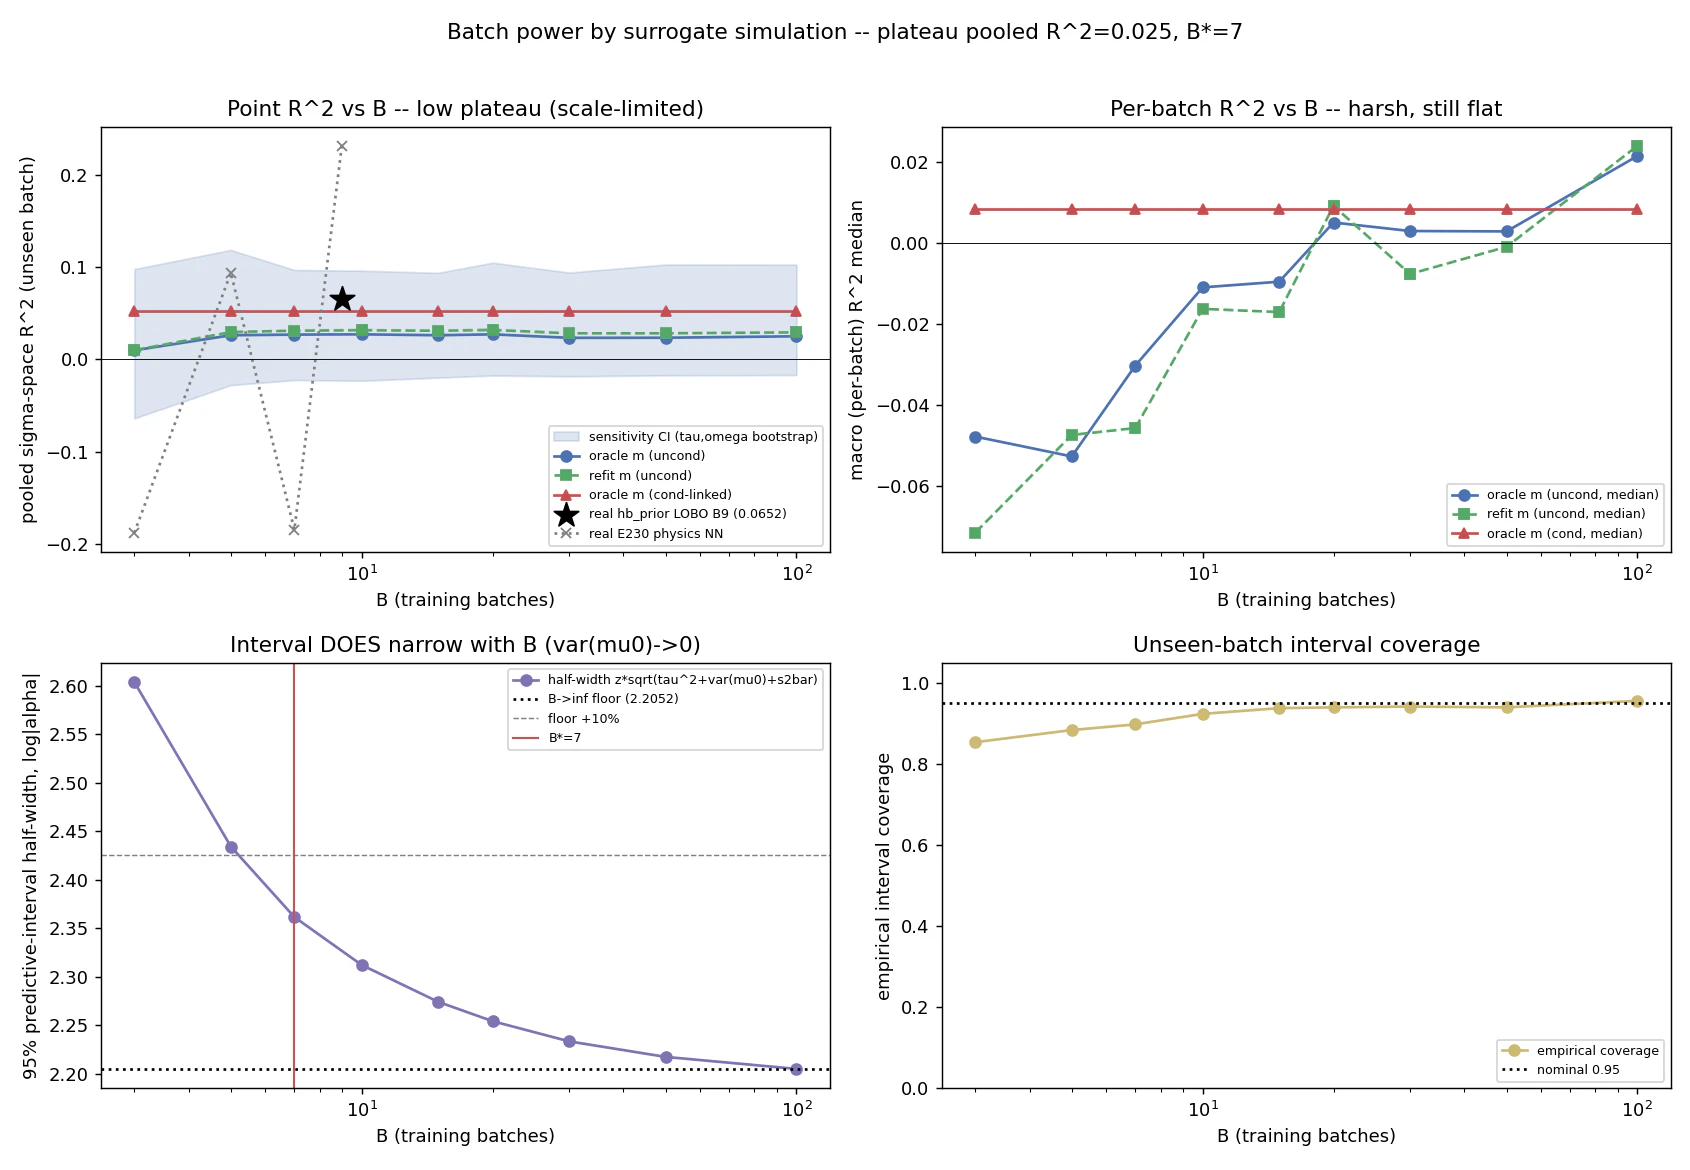
No covariate I could compute recovered the gain: conditioning time, thickness, width, microscope curvature, image texture, none of them. One physical measurement does. Calibrate on a specimen's own first frames of low-load ramp and unseen-batch R² climbs from 0.42 at five frames to 0.67 at ten and 0.74 at twenty. A single force-stroke stiffness reading ranks α at Spearman 0.75, against 0.11 with no measurement. A simulation calibrated to the data says more batches would not have saved the point estimate, R² still near zero at 30 batches, while a calibrated interval is within 10 percent of its floor by about five. So the honest deliverable is an interval: a surrogate posterior-predictive band with at least 0.80 coverage on all ten held-out batches, where pooled conformal collapses to 0.55.
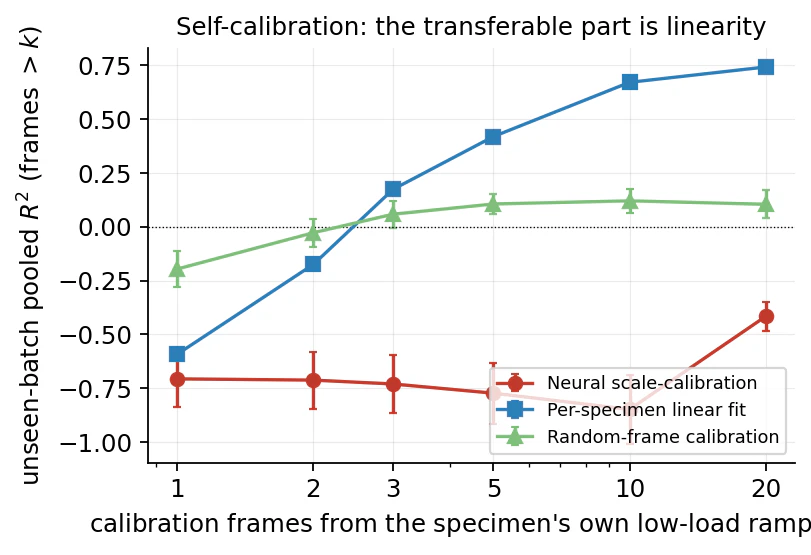
Unseen-batch R² against number of calibration frames for three methods; the per-specimen linear fit rises from below zero to 0.74 at twenty frames
Self-calibration on a specimen's own early frames: R² 0.42, 0.67, 0.74 at k = 5, 10, 20.
Four panels from the batch-count simulation: pooled and per-batch R² flat near zero against training batches, interval half-width narrowing, and coverage near nominal
More batches do not buy point accuracy: R² plateaus near zero at 30 batches; the interval converges by about 5.
Coverage against interval width for four interval methods, one point per held batch, and a bar chart of per-batch coverage for the surrogate posterior-predictive band with batch 10 lowest at 0.82
Coverage against width for every interval method. Only the surrogate band clears 0.80 on every batch.
06

Fields

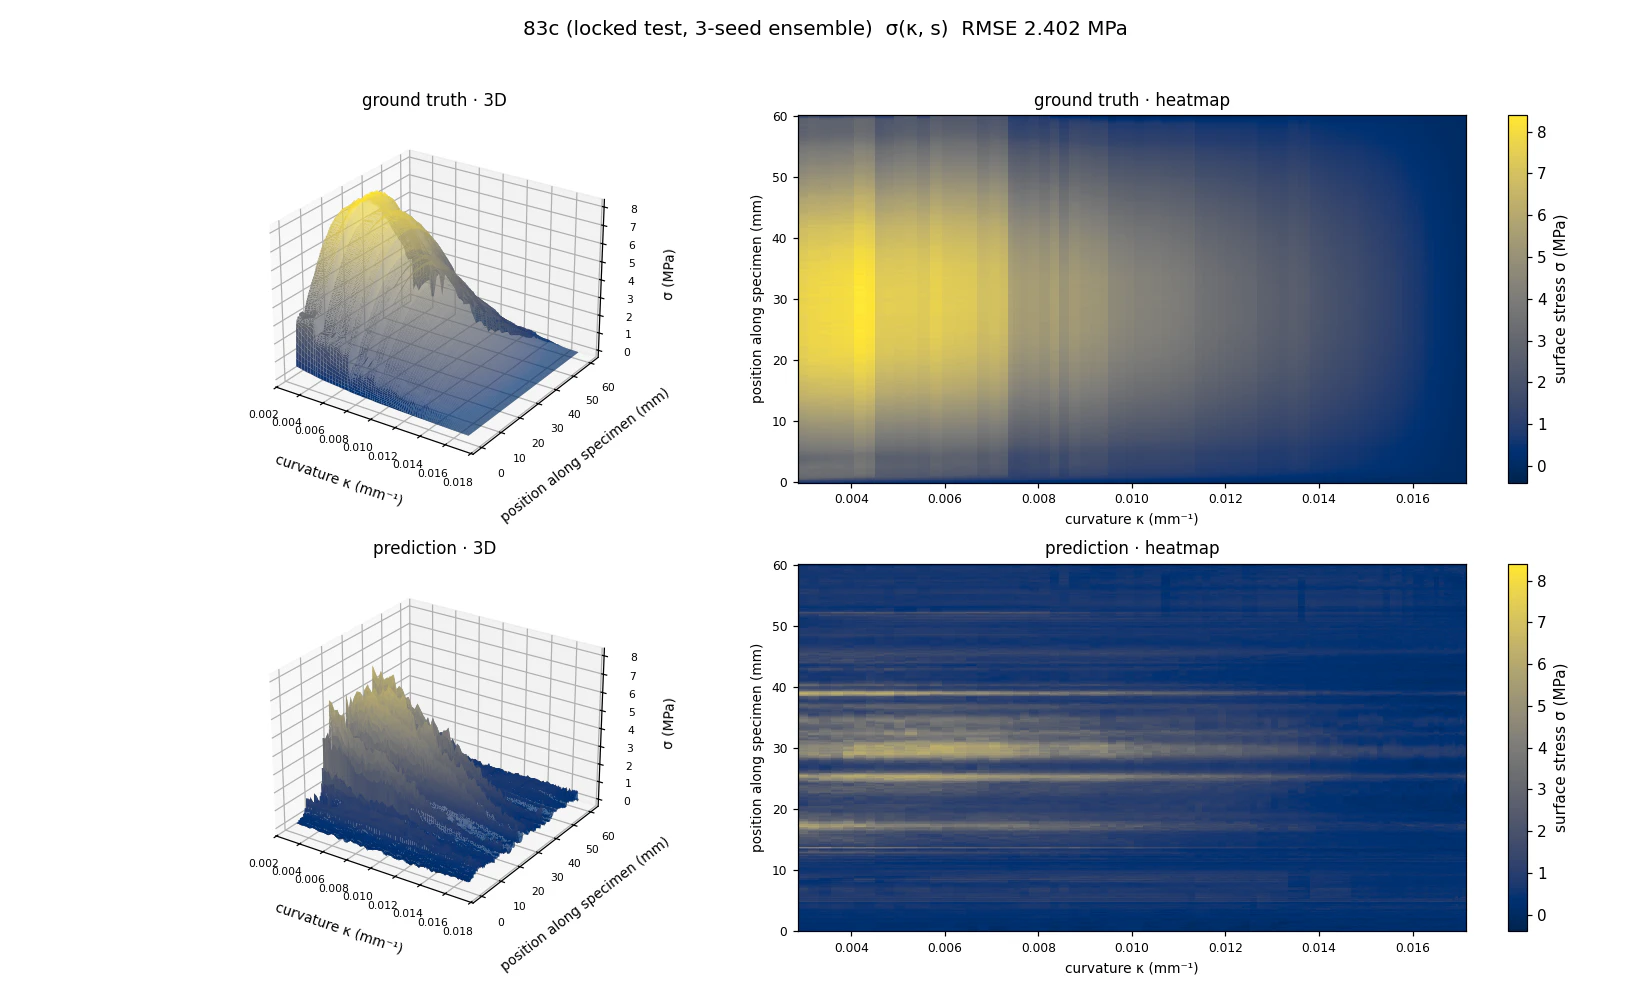
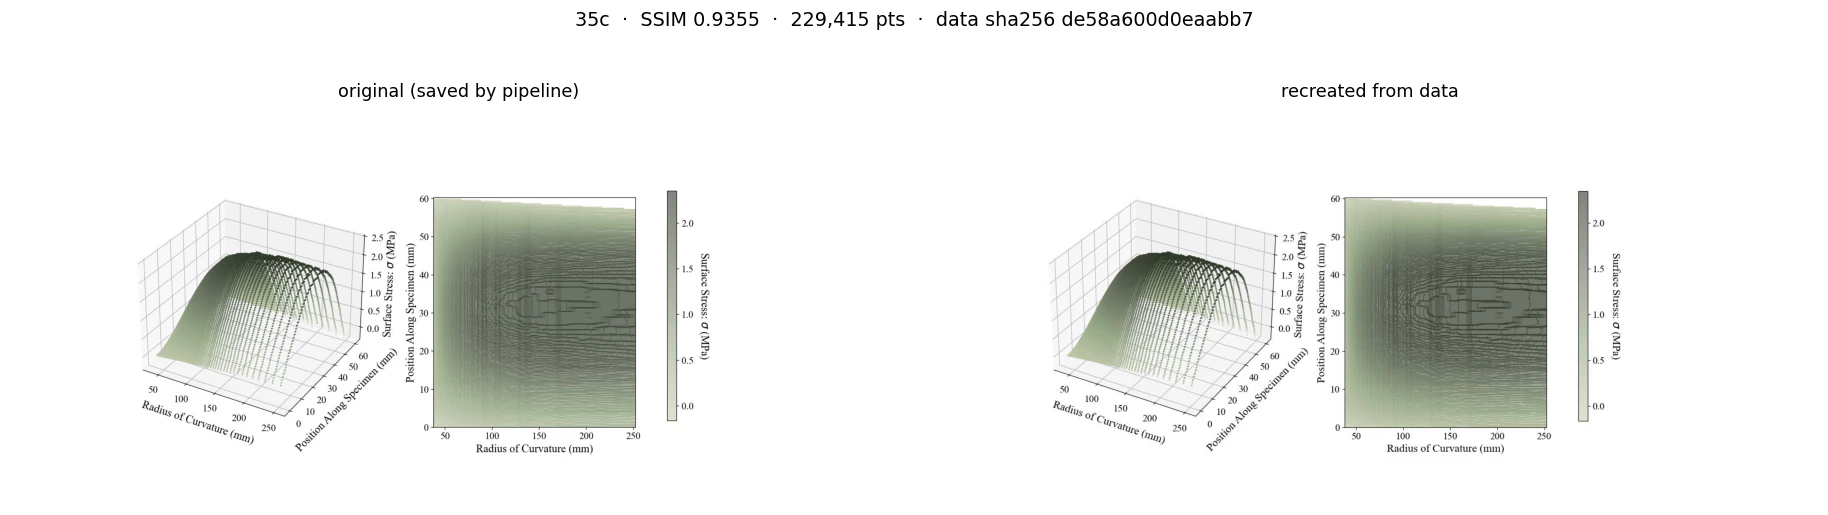
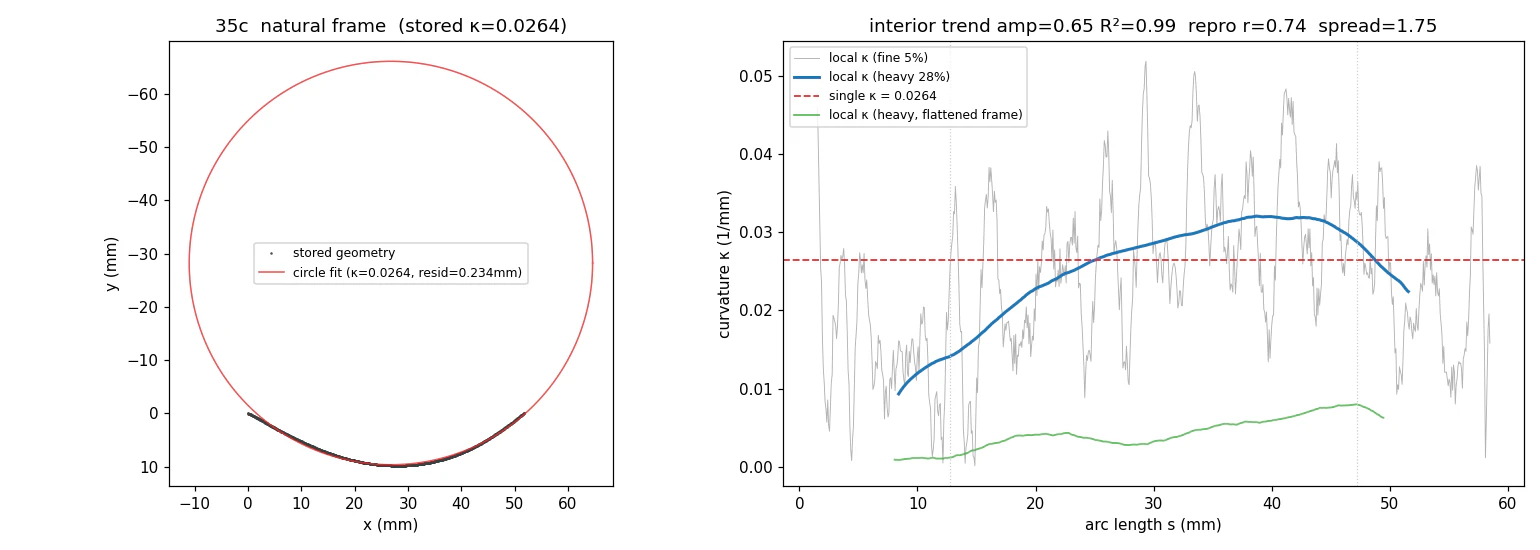
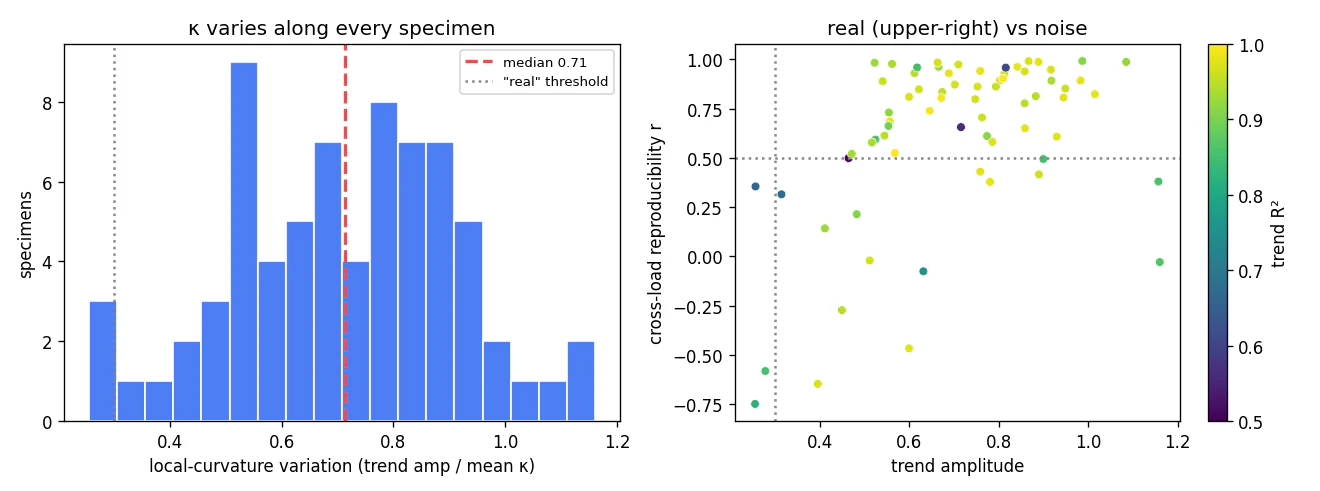
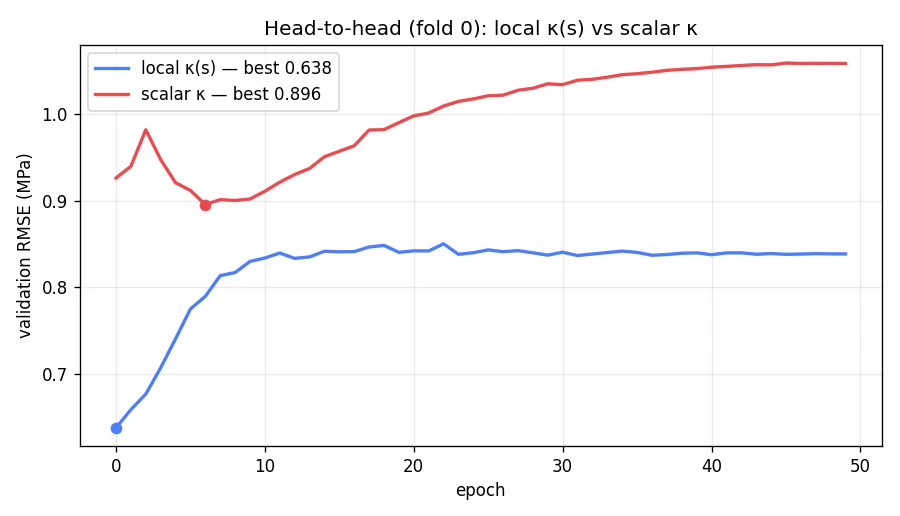
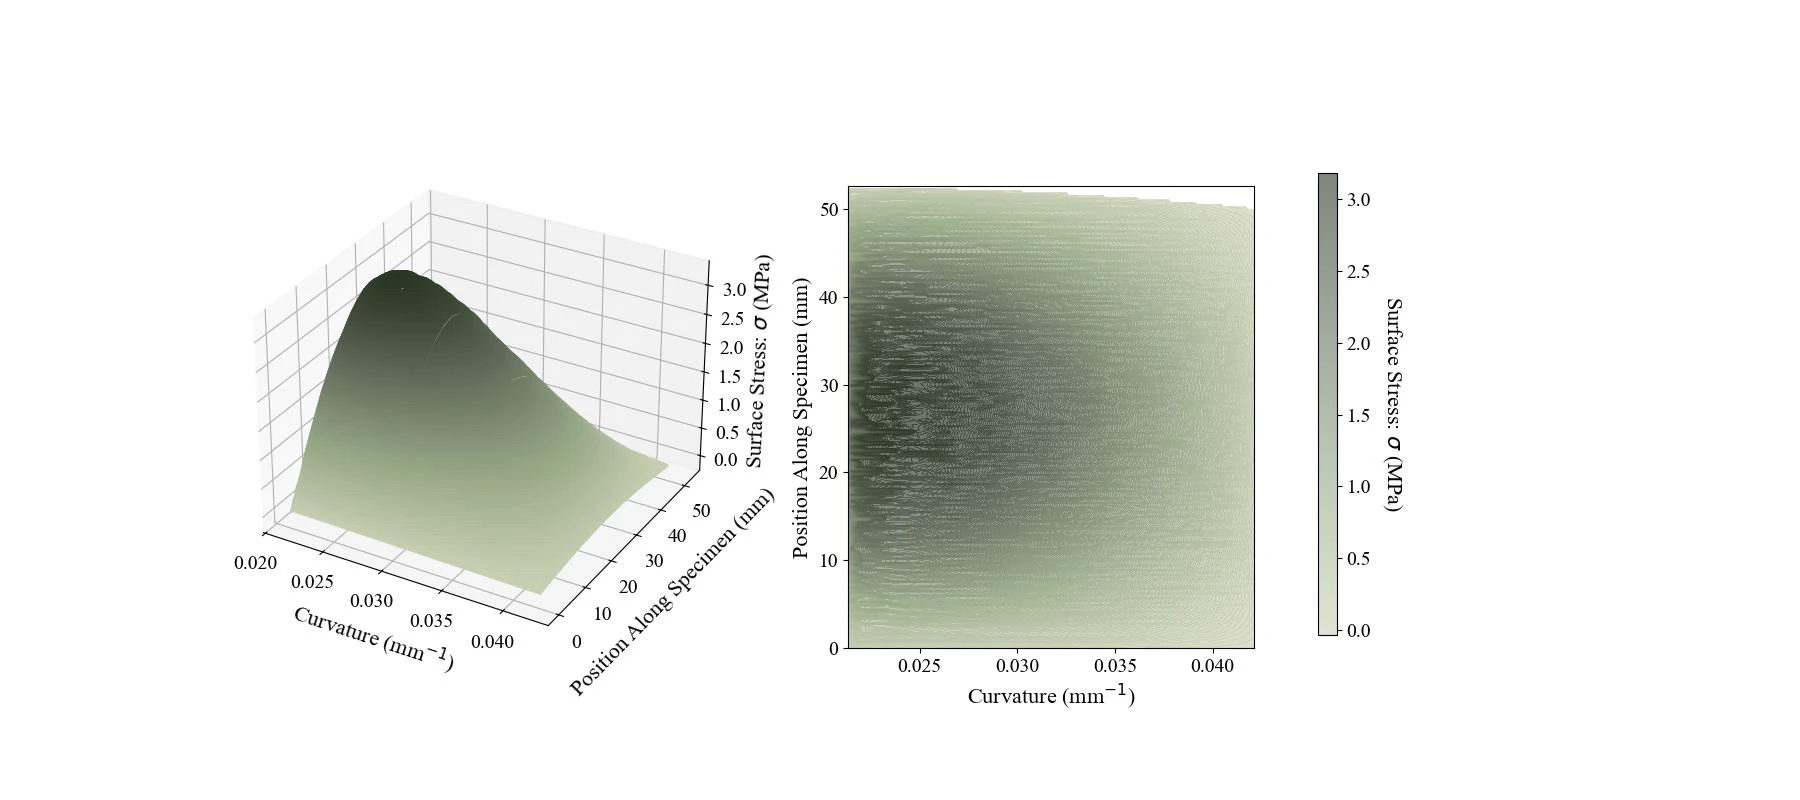
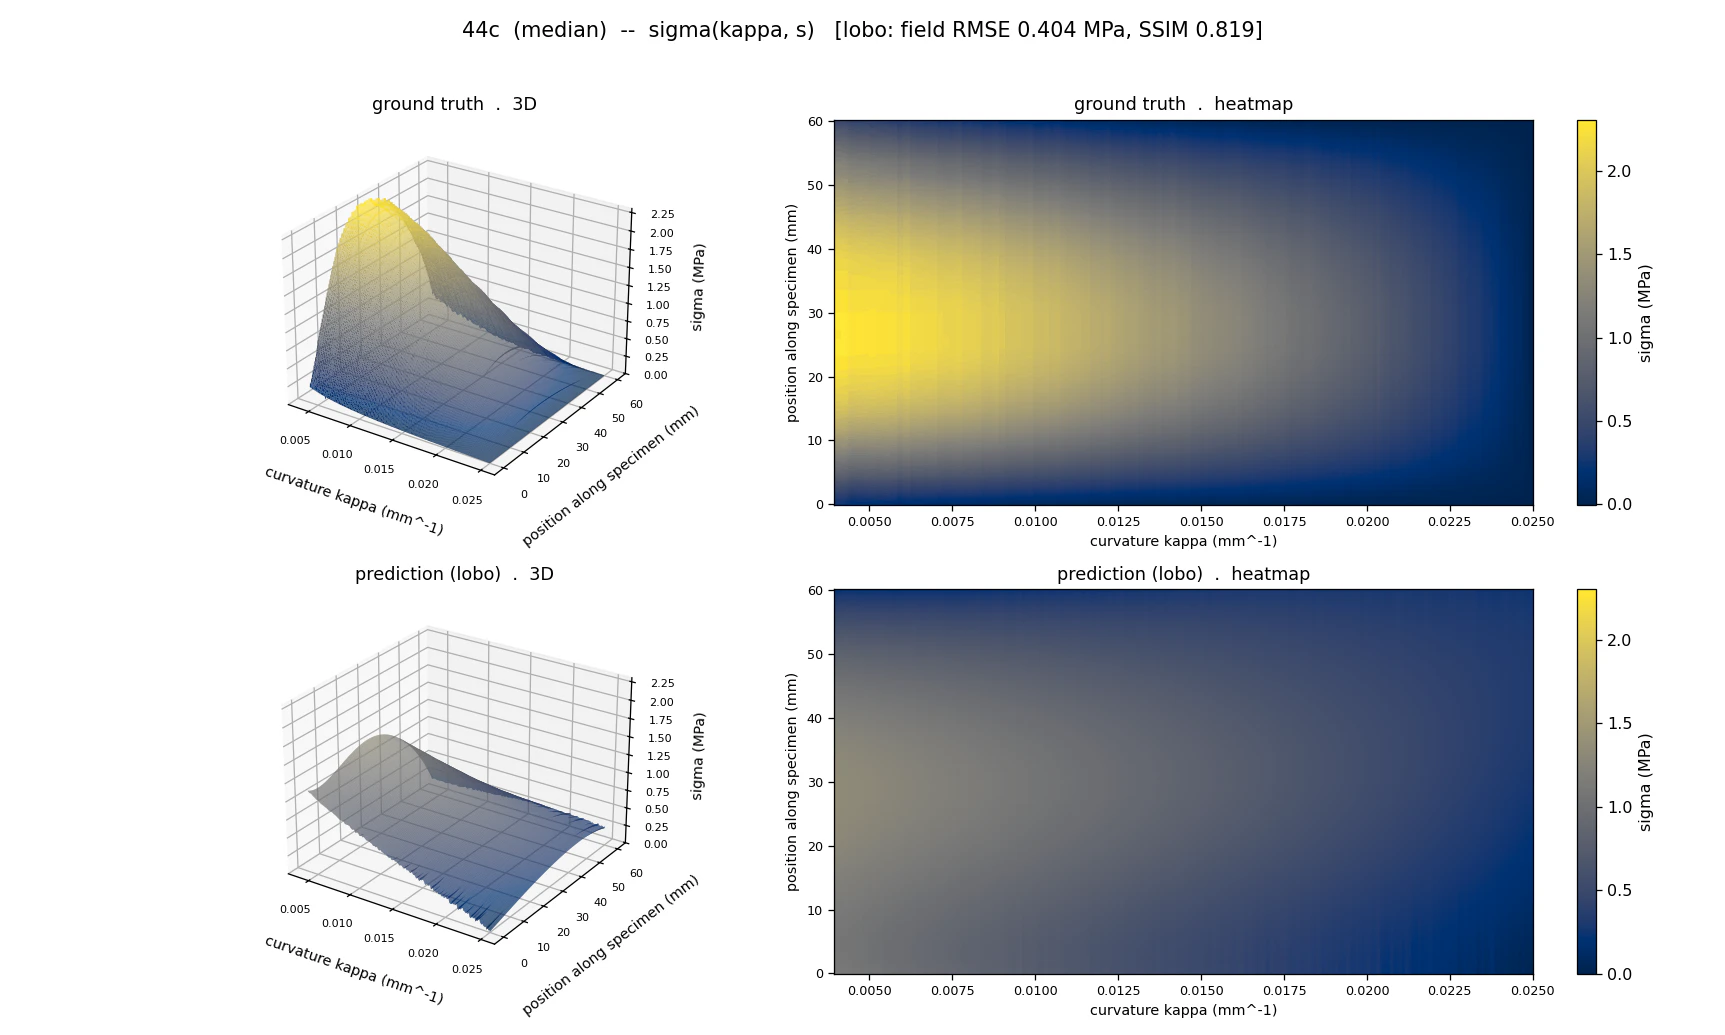
The quantity itself: surface stress over position along the strip and curvature, one field per specimen. A few things the fields taught me. The pipeline reproduces its own saved figures from raw data at SSIM 0.94. The single scalar curvature I had been feeding the model throws away a real local variation along each strip, median amplitude about 70 percent of the mean and genuine in 67 of 72 specimens; feeding the local profile instead cut best validation RMSE from 0.896 to 0.638 MPa. And the stiff batch, 81c to 89c, survives geometry correction at 6.7 times, so it stayed in the dataset as a real batch rather than being dropped as an outlier.
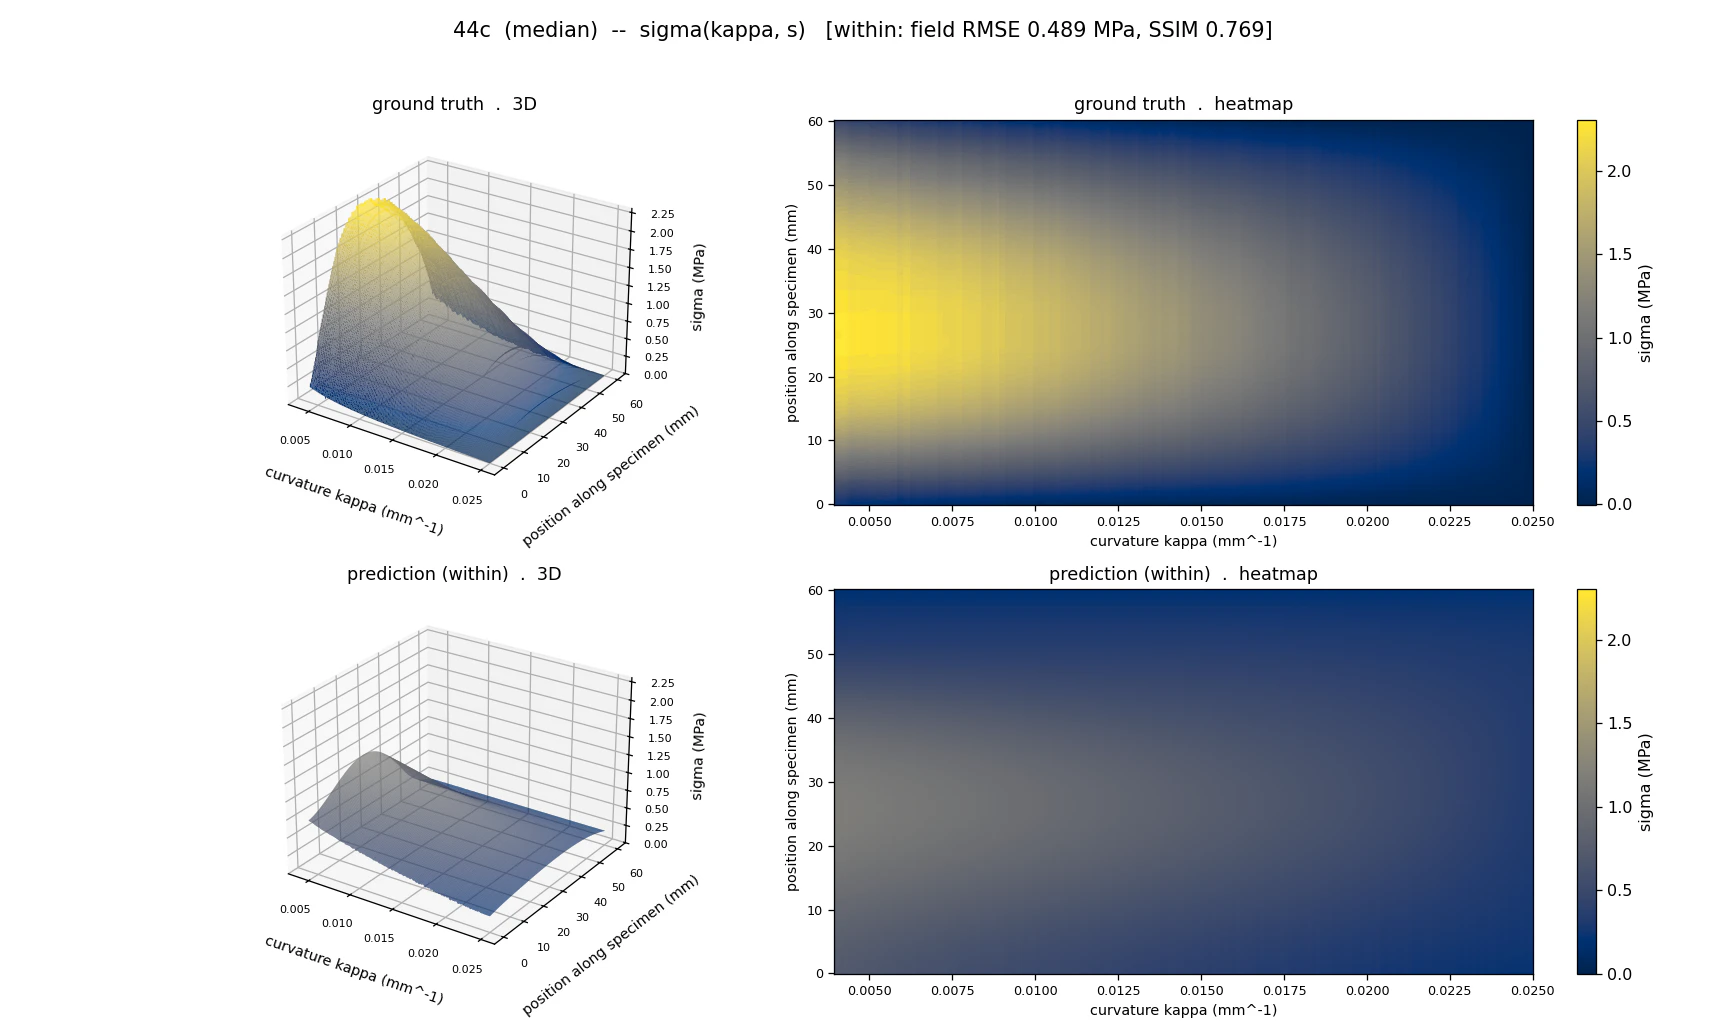
Ground-truth and predicted stress fields for specimen 44c as 3D surfaces and heatmaps, batch seen in training; the prediction is flatter than the truth
Specimen 44c with its batch seen in training.
Ground-truth and predicted stress fields for specimen 44c as 3D surfaces and heatmaps, batch held out of training
Specimen 44c with its batch held out.
Ground-truth and predicted stress fields for specimen 83c from the stiff batch, the truth peaking near 8 MPa and the prediction striped and low
Specimen 83c, from the stiff batch 81c-89c. Locked test, 3-seed ensemble.
Side-by-side original and recreated stress field for specimen 35c, a 3D surface and heatmap each, near identical
Pipeline check: field recreated from raw data against the saved original. SSIM 0.94.
Left, specimen 35c's stored geometry with a fitted circle; right, local curvature along the arc length varying around the single stored value
Local κ(s) along specimen 35c against the single stored κ.
Histogram of local-curvature variation across 72 specimens with the median at 0.71, and a scatter of cross-load reproducibility against trend amplitude
Local-curvature variation across all 72 specimens, median about 70 percent of the mean.
Validation RMSE against epoch for two inputs: the local curvature profile settling near 0.84 MPa with a best of 0.638, scalar curvature drifting above 1.0 with a best of 0.896
Local κ(s) against scalar κ, fold 0: best validation RMSE 0.638 against 0.896 MPa.
Per-specimen shape-actuation-modulus slope magnitude plotted by batch, batches 1 to 10, with batch 10 far above the rest
Shape-Actuation-Modulus slope per specimen, by batch.
The target quantity: surface stress over curvature and position along the specimen, as a 3D surface and a heatmap in muted green
The target: surface stress against position and curvature.
07

Paper

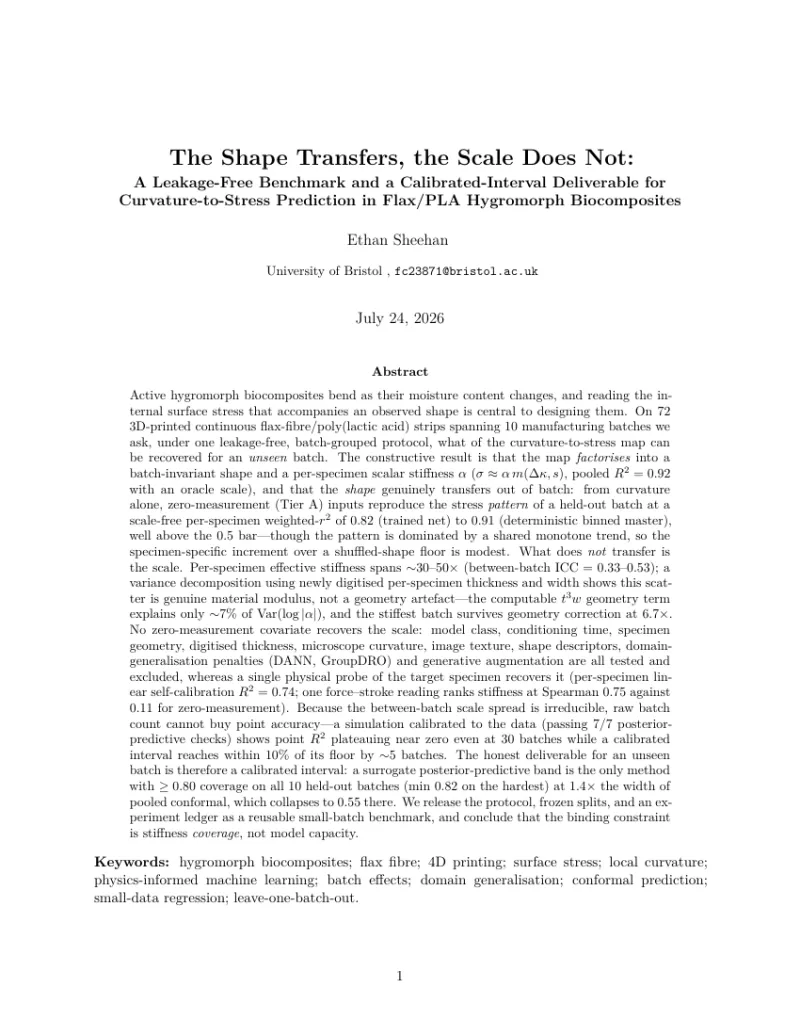
Written up as a full paper in July 2026: The Shape Transfers, the Scale Does Not. A Leakage-Free Benchmark and a Calibrated-Interval Deliverable for Curvature-to-Stress Prediction in Flax/PLA Hygromorph Biocomposites. The protocol, frozen splits and experiment ledger go with it as a reusable small-batch benchmark. The conclusion in one line: the relationship is universal, only its gain is unknown, and the gain is a per-specimen material property you have to measure. One probe of the specimen recovers it; no number of batches or amount of model capacity does.